View your pop-up statistics
Statistics help you find out how many site visitors saw your pop-ups, interacted with them, gave their contact info, or subscribed to your chatbot. With SendPulse, you can view the statistics of each website separately or get overall information for a certain period of time.
Overall statistics
You can find your pop-up statistics on the main page. Track how many views, interactions, and leads your website has gathered over a certain period of time using a separate graph for each metric.
The main panel displays your key account info:
- Your pricing plan and the number of views you gathered during your billing period.
- Your website graph where you can select a period of time for which you want to view your statistics.
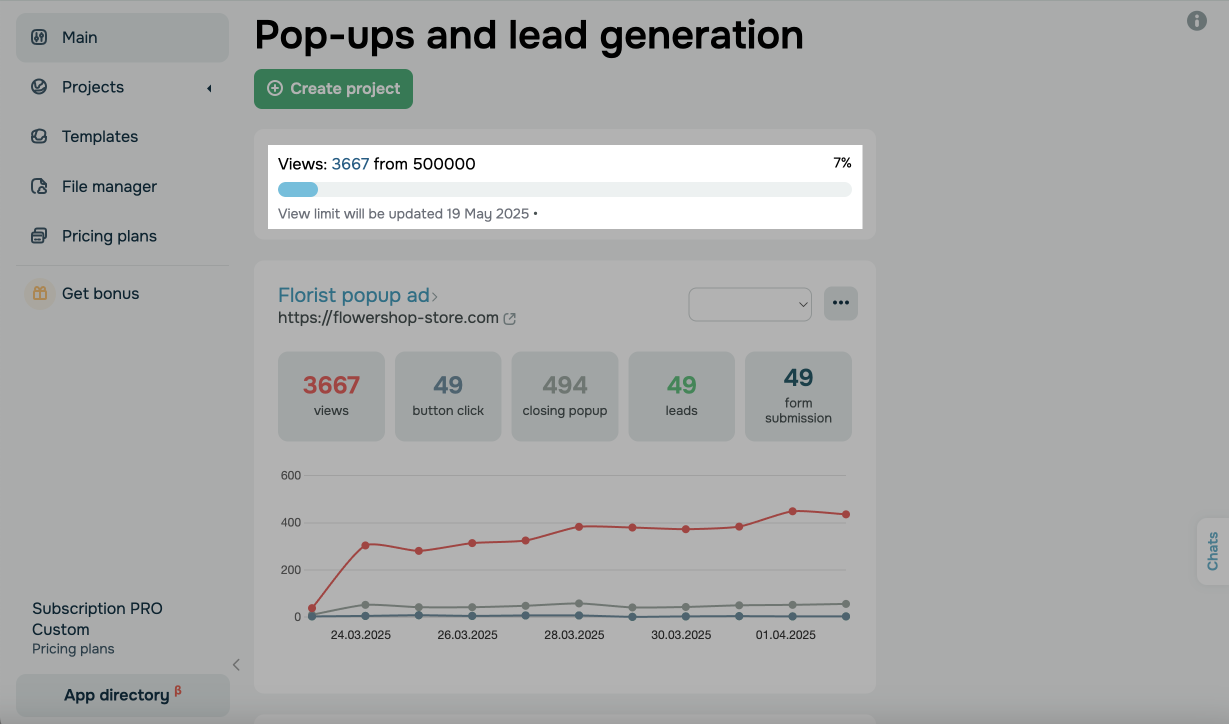
| Views | The number of times your widget was viewed. |
| Interactions | Shows how many visitors interacted with your widget, expanded it, read its message, and clicked on your button and followed the link. |
| Leads | The number of customers which shared their email addresses or phone numbers while submitted the pop-up. These contacts will be saved to the Analytics tab in the pop-up service, your CRM deals and contacts, and your mailing list if you enable a corresponding option when setting up your pop-up action. |
| Social widget | Shows your social media buttons’ click-through rate on your floating panel’s social media buttons. |
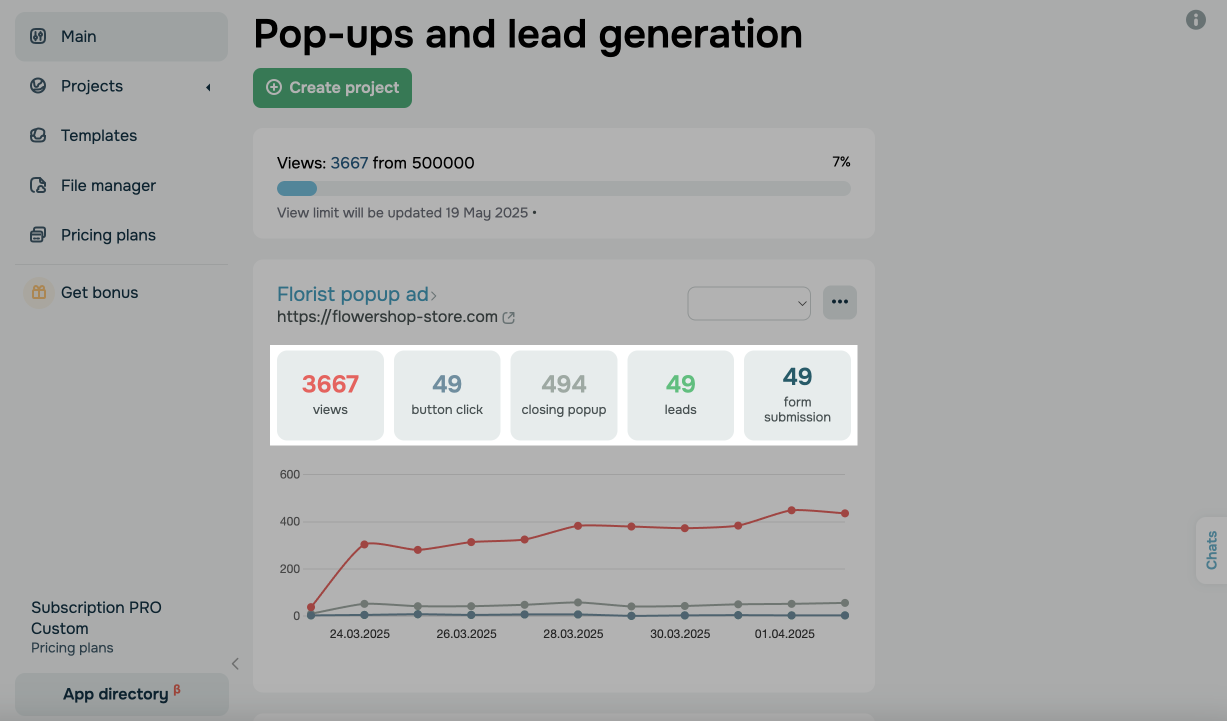
You can also select a period of time for which you want to view your statistics (day, week, month, or all time).
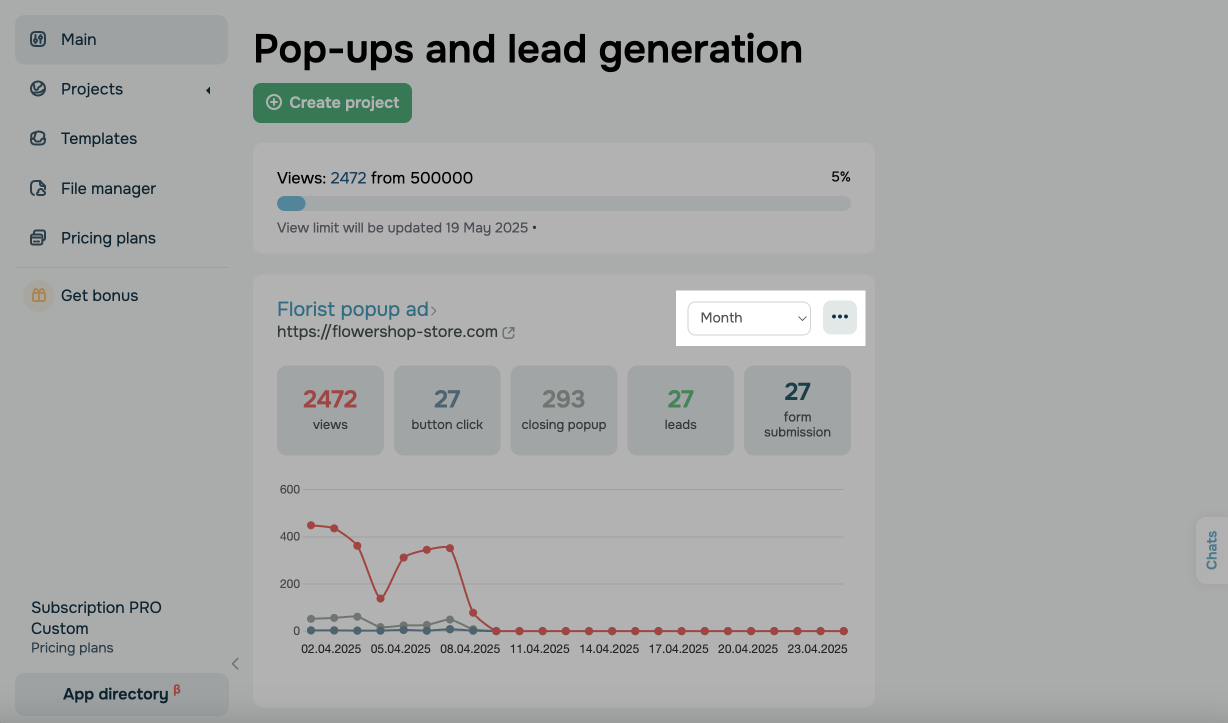
To view statistics for a specific day, hover over the graph.
website statistics
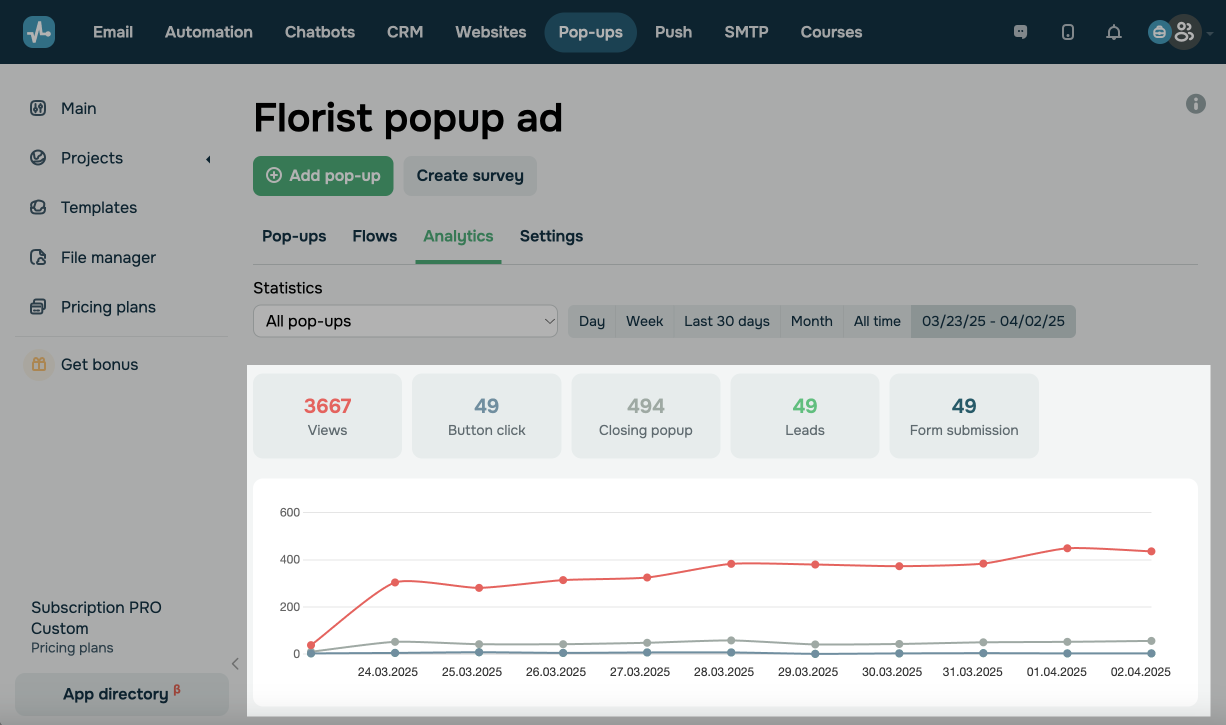
Select a website and go to the Analytics tab to view your overall website statistics.
Performance data
Below you will see a graph with your performance indicators — these are the same indicators we described in the Overall Statistics section.
You can choose a period of time for which you want to view your statistics.
To view statistics for a specific day, hover over the graph.
Lead data
Below the graph, there is a list of leads collected via pop-ups. You can view each contact’s name, details, scenario using which they were added, region, time of the last session, and source (the planet icon is displayed if a user visited an active pop-up from a site, for example, google.com).
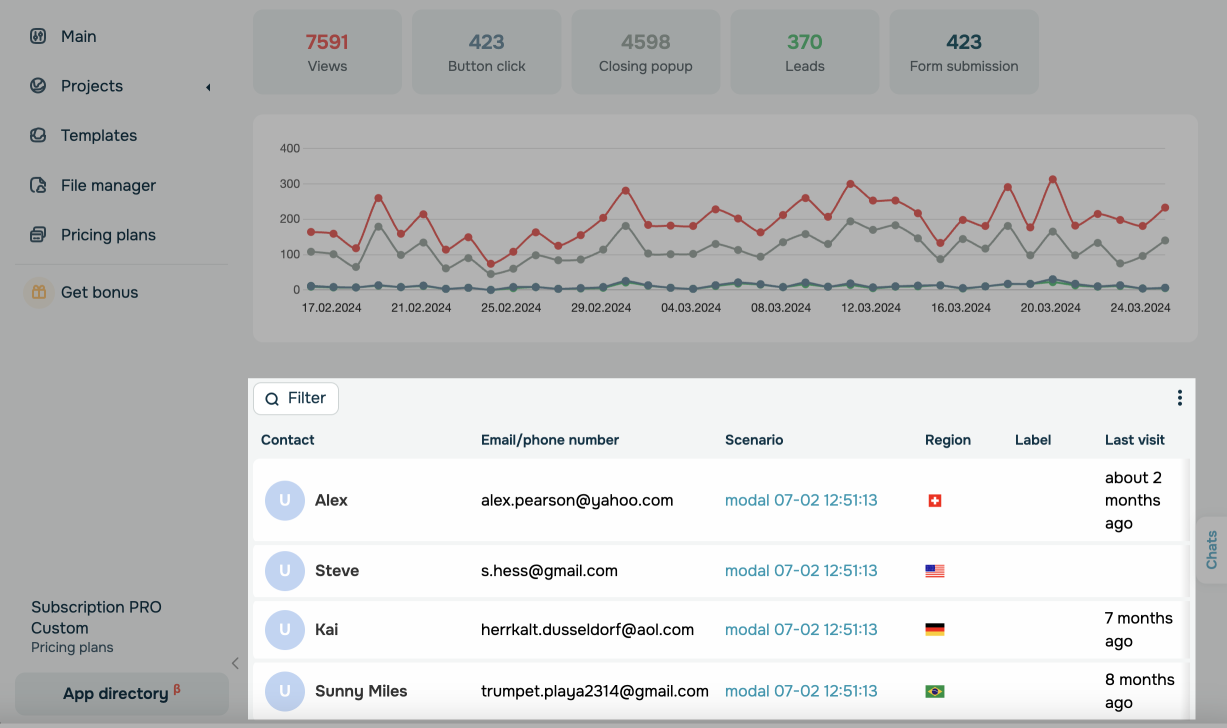
You can go to a contact card in CRM by clicking a contact name.
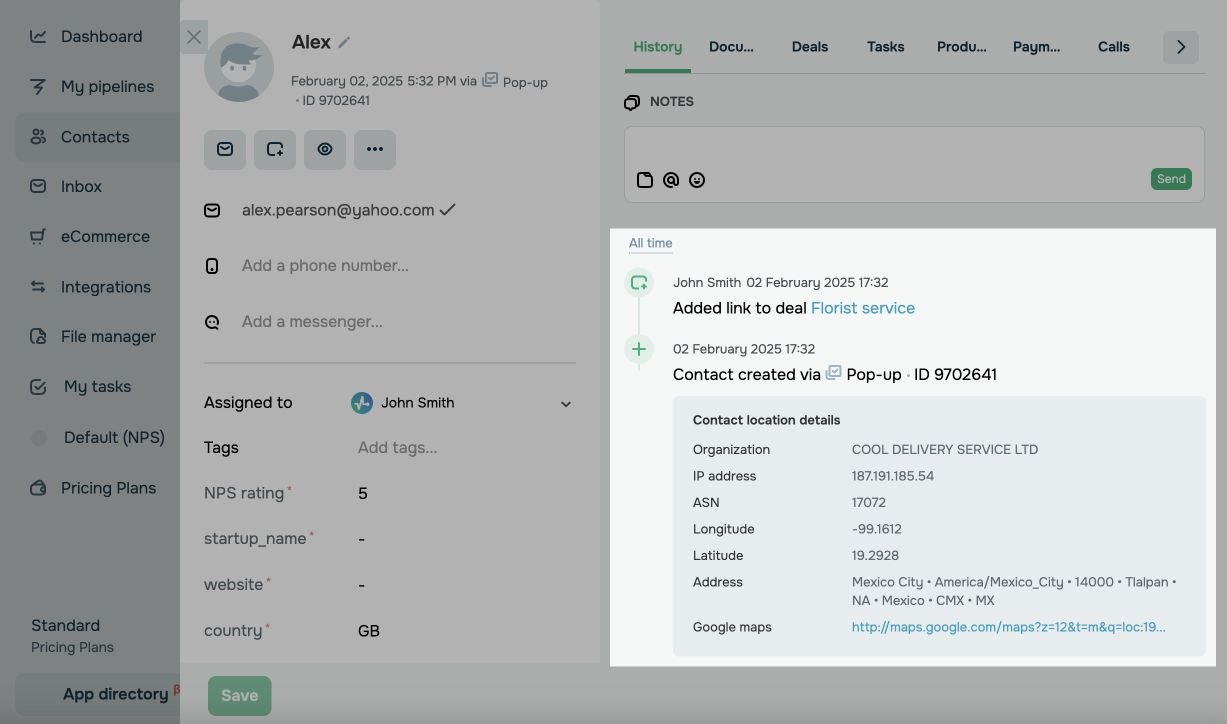
In a contact card, you can see the following details:
| Organization | An Internet service provider. |
| IP address | A user’s unique IP address. |
| ASN | A unique provider number. |
| Longitude and latitude | Approximate coordinates of a user's location during their interaction with a pop-up. |
| Address | A user’s approximate address during the interaction with a pop-up. |
| Google Maps |
A link to Google Maps with an approximate address. This information is also saved to your mailing list in the email service if the |
Displaying the region data in CRM and the pop-up builder is available only with a paid pricing plan. However, displaying other lead data in CRM is available with any pricing plan, including the free one.
Pop-up statistics
Analyze and compare your subscription and engagement rates to select the most creative scenarios and the most effective triggers.
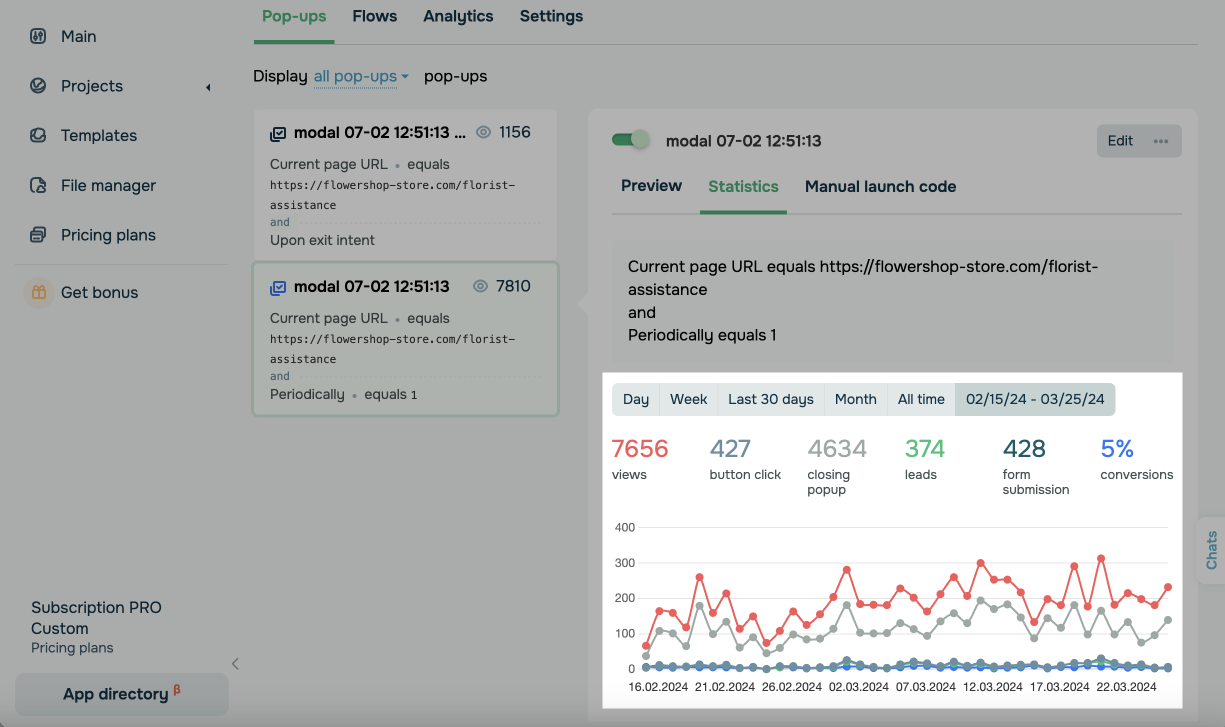
Go to the Pop-ups tab. You will see the list of your pop-ups and their scenarios and number of views.
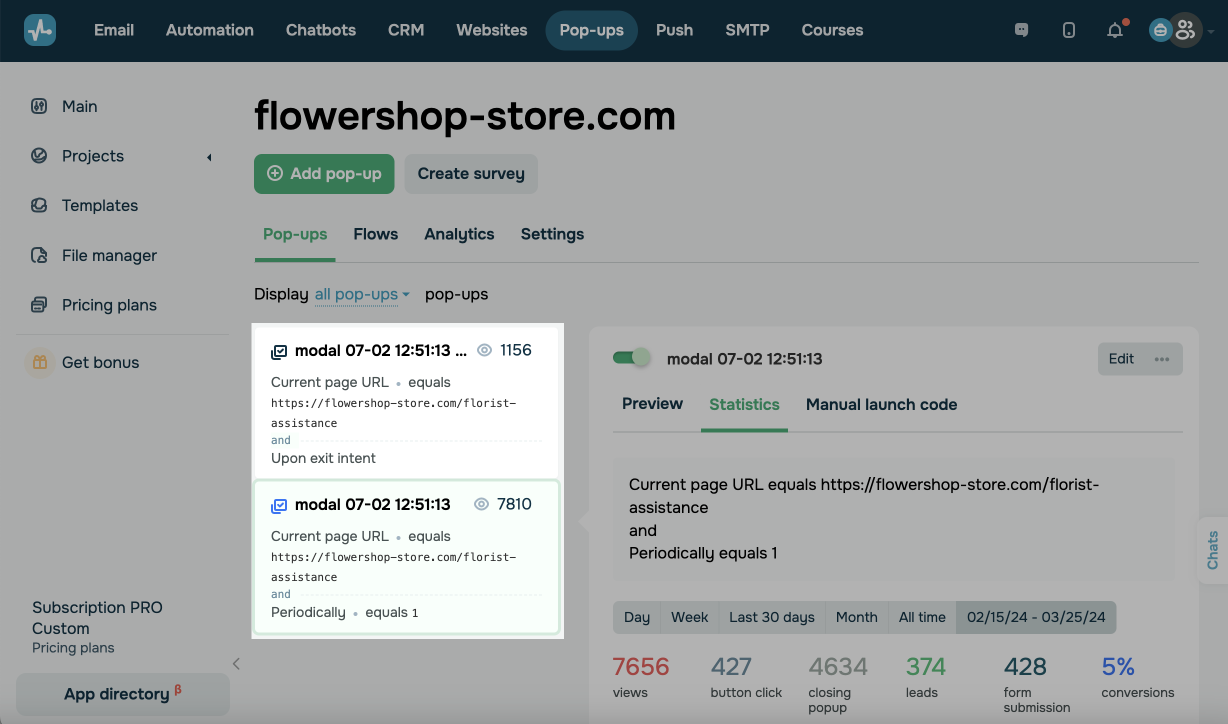
Select a scenario and go to Statistics tab. The data about each scenario will be displayed here.
Depending on your pop-up type, you may or may not see certain indicators. For example, if you do not have social media buttons, then there will be no corresponding data.
You can select a period of time for which you want to view your statistics (day, week, last 30 days, current month, or all time).
There are two metrics available in your launcher statistics: the number of views and clicks.
To monitor the statistics of your Launcher and the pop-up it triggers, you need to view the number of launcher clicks and views and pop-up actions individually. To do this, switch between the linked pop-ups in your website, and go to the Statistics tab.
You can configure the display conditions for your launcher and its linked pop-up individually. For example, a pop-up can appear even without clicking the launcher if its selected trigger condition is based on a certain scroll percentage or time spent on the page. So, your pop-up statistics will be different from your launcher statistics.
Last Updated: 02.02.2024
or