How to track your web push campaign statistics
SendPulse collects statistics on your web push campaigns’ delivery and click-through rates. This helps evaluate the effectiveness of web push campaigns on your website.
In this article, we will talk about how to collect and track statistics in your SendPulse and Google Analytics 4 accounts.
Create a web push campaign
Go to the Push section, and click Send PUSH.
Fill in the fields (title, notification text, and notification link), select an image, and add buttons.
Read more: How to create and send a push campaign.
Set up statistics collection
To collect site statistics on your web push campaigns, enable adding UTM tags to your mailing list.
How to work with UTM tags
UTM tags are parameters that allow you to determine your traffic source.
Required UTM tags:
utm_campaign |
Campaign ID using which you can find campaigns in statistics collection and analysis services |
utm_source |
Traffic source and advertising system |
utm_medium |
Traffic channel |
How to add UTM tags to web push campaigns
The service provides three ways to use UTM tags in web push campaigns:
- enable all service tags by default;
- set your own value for
utm_campaign; - set your own tags.
To enable all service tags by default, click the settings button, and select the UTM parameters checkbox.
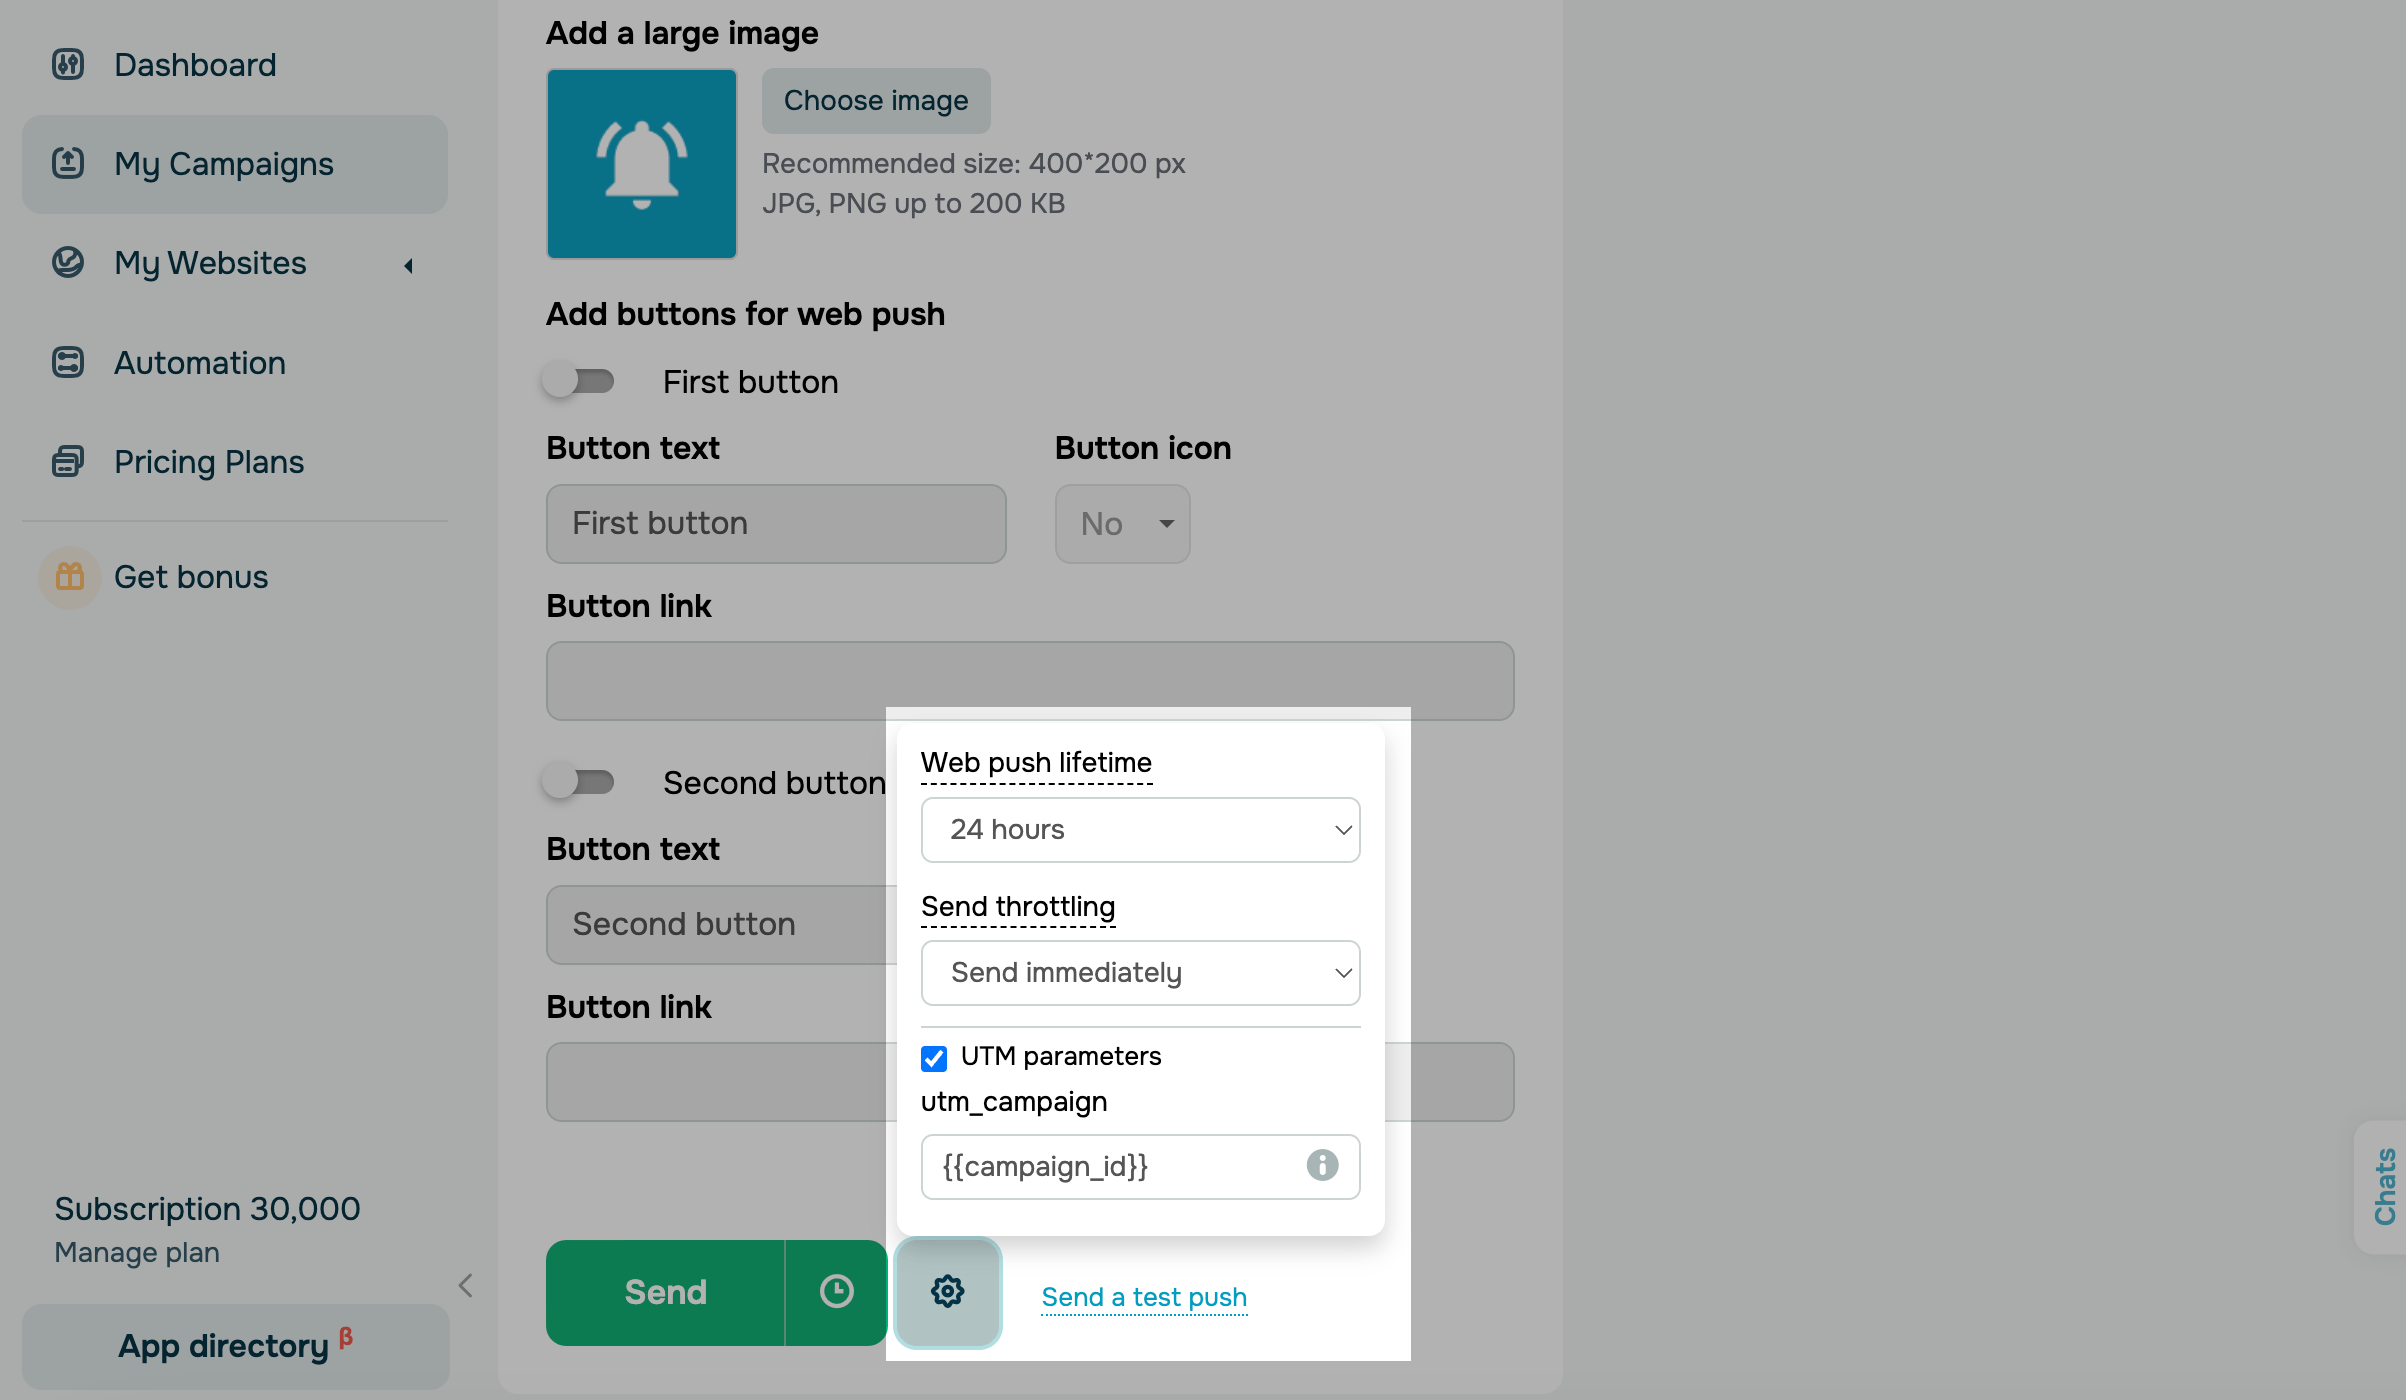
When your notification is sent, the utm_campaign=1111 (your the push campaign ID), utm_source=sendpulse, and utm_medium=push tags will be added to your link.
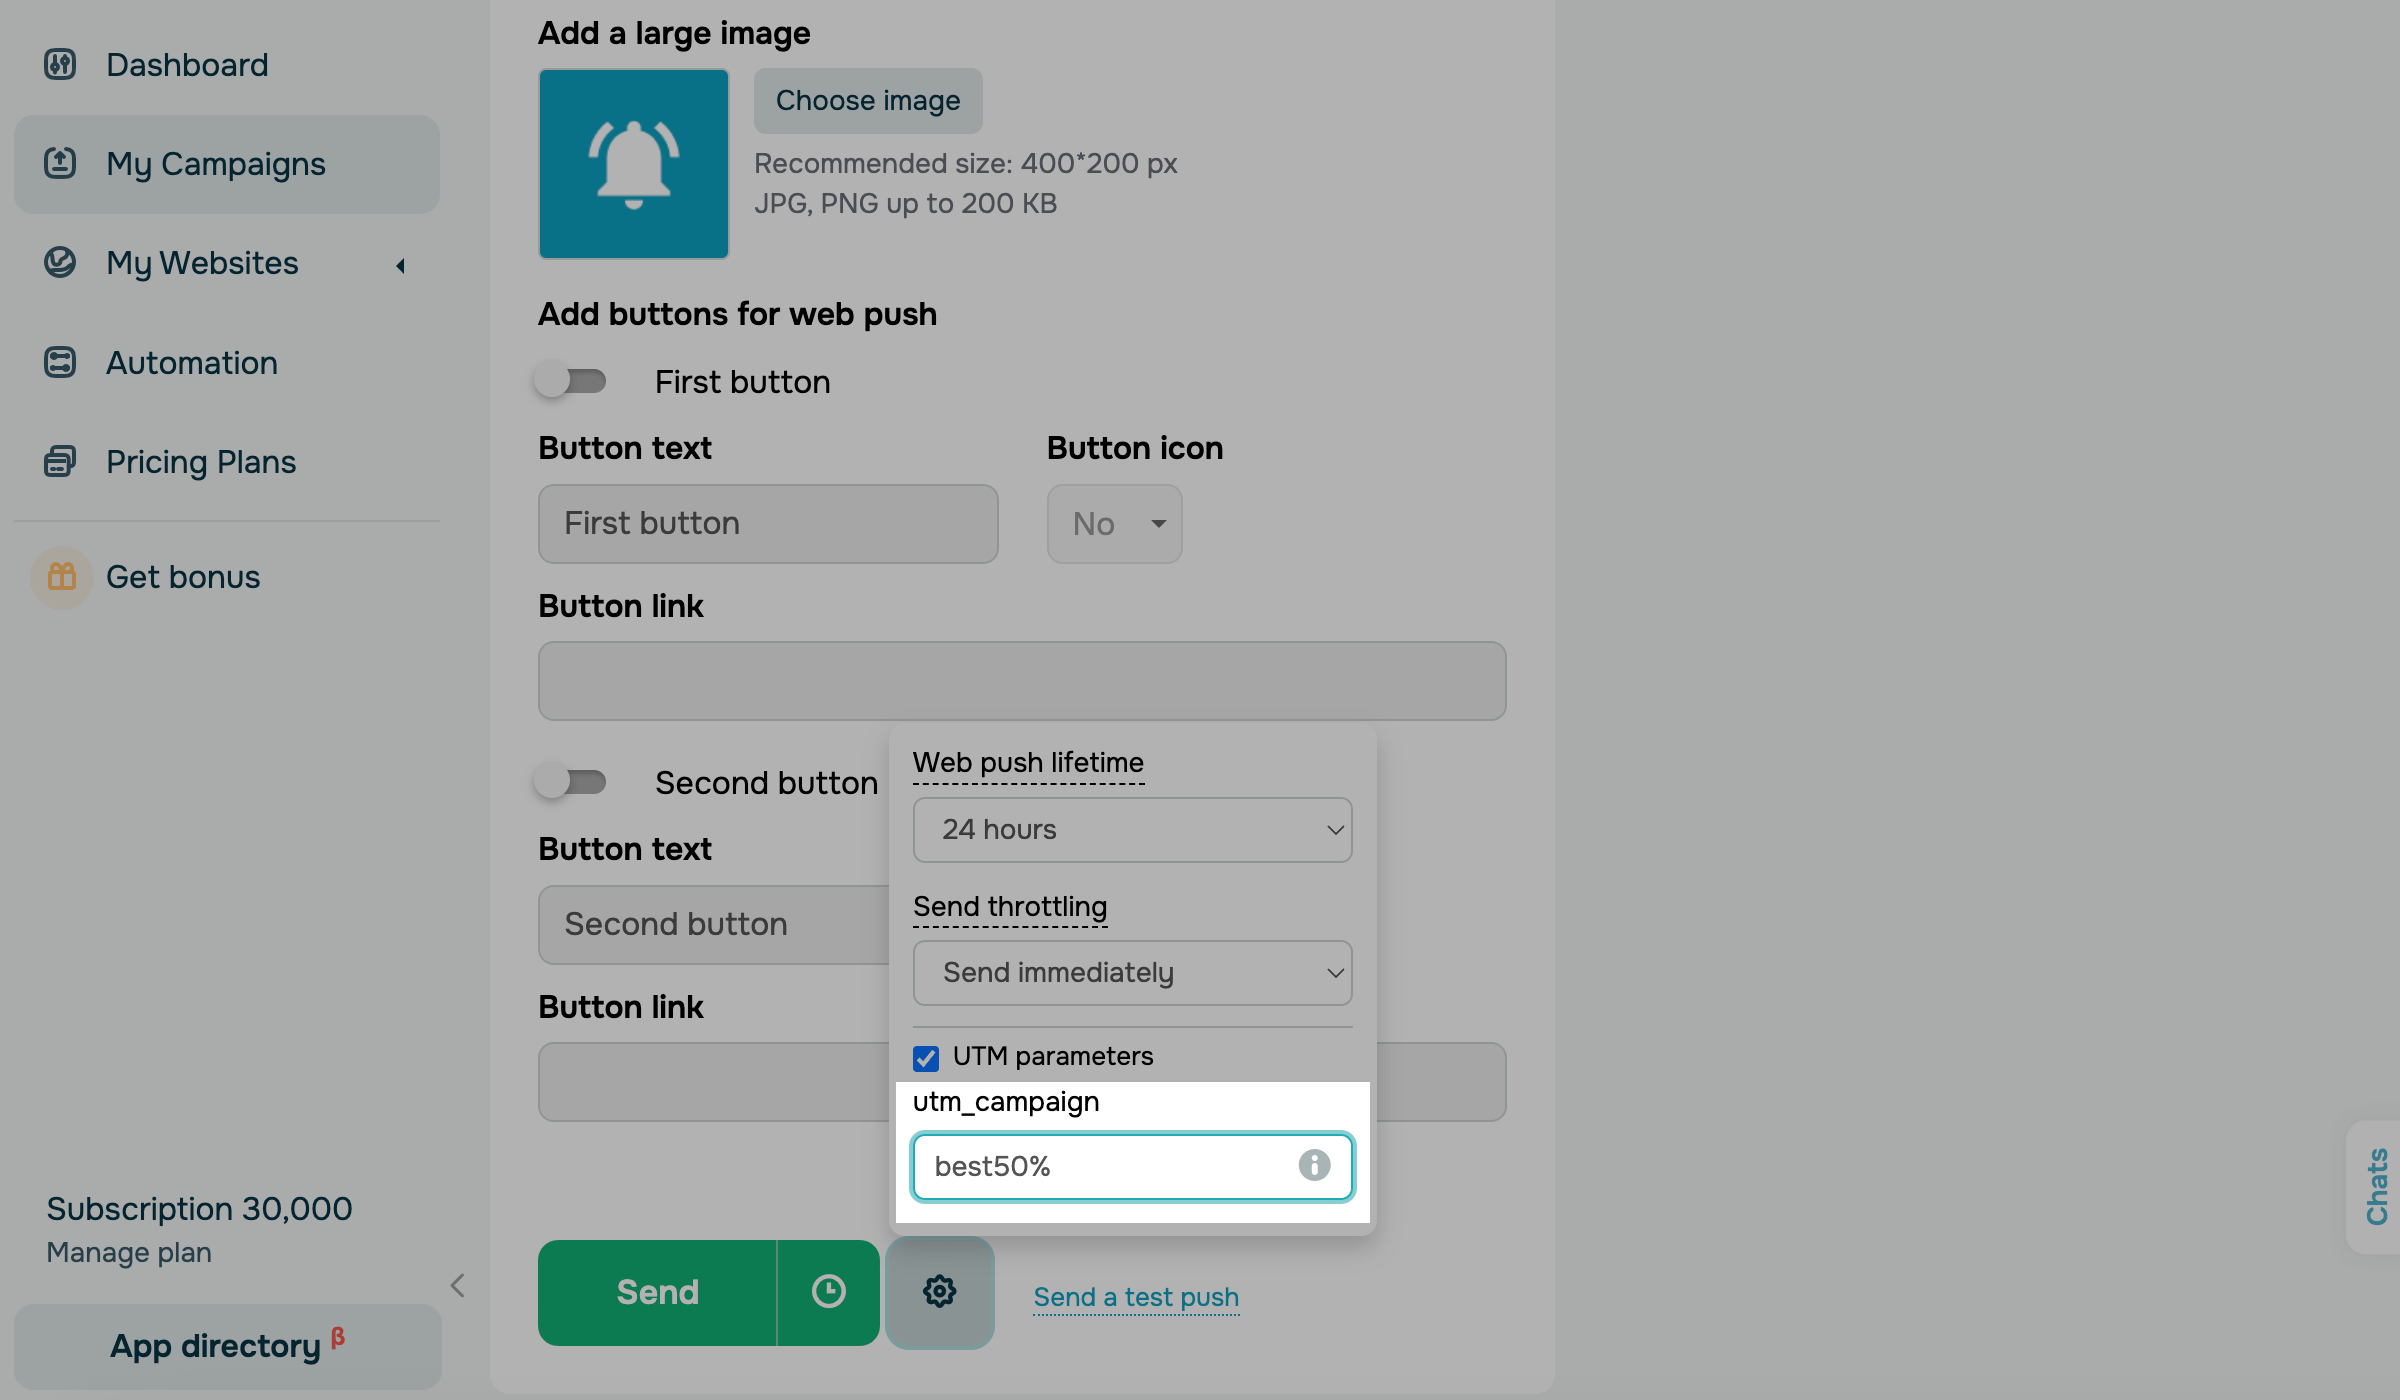
To set your own value for a UTM tag, enter your own campaign ID in the utm_campaign field, for example, best50%.
When your notification is sent, the utm_campaign=best50%, utm_source=sendpulse, and utm_medium=push tags will be added to your link.
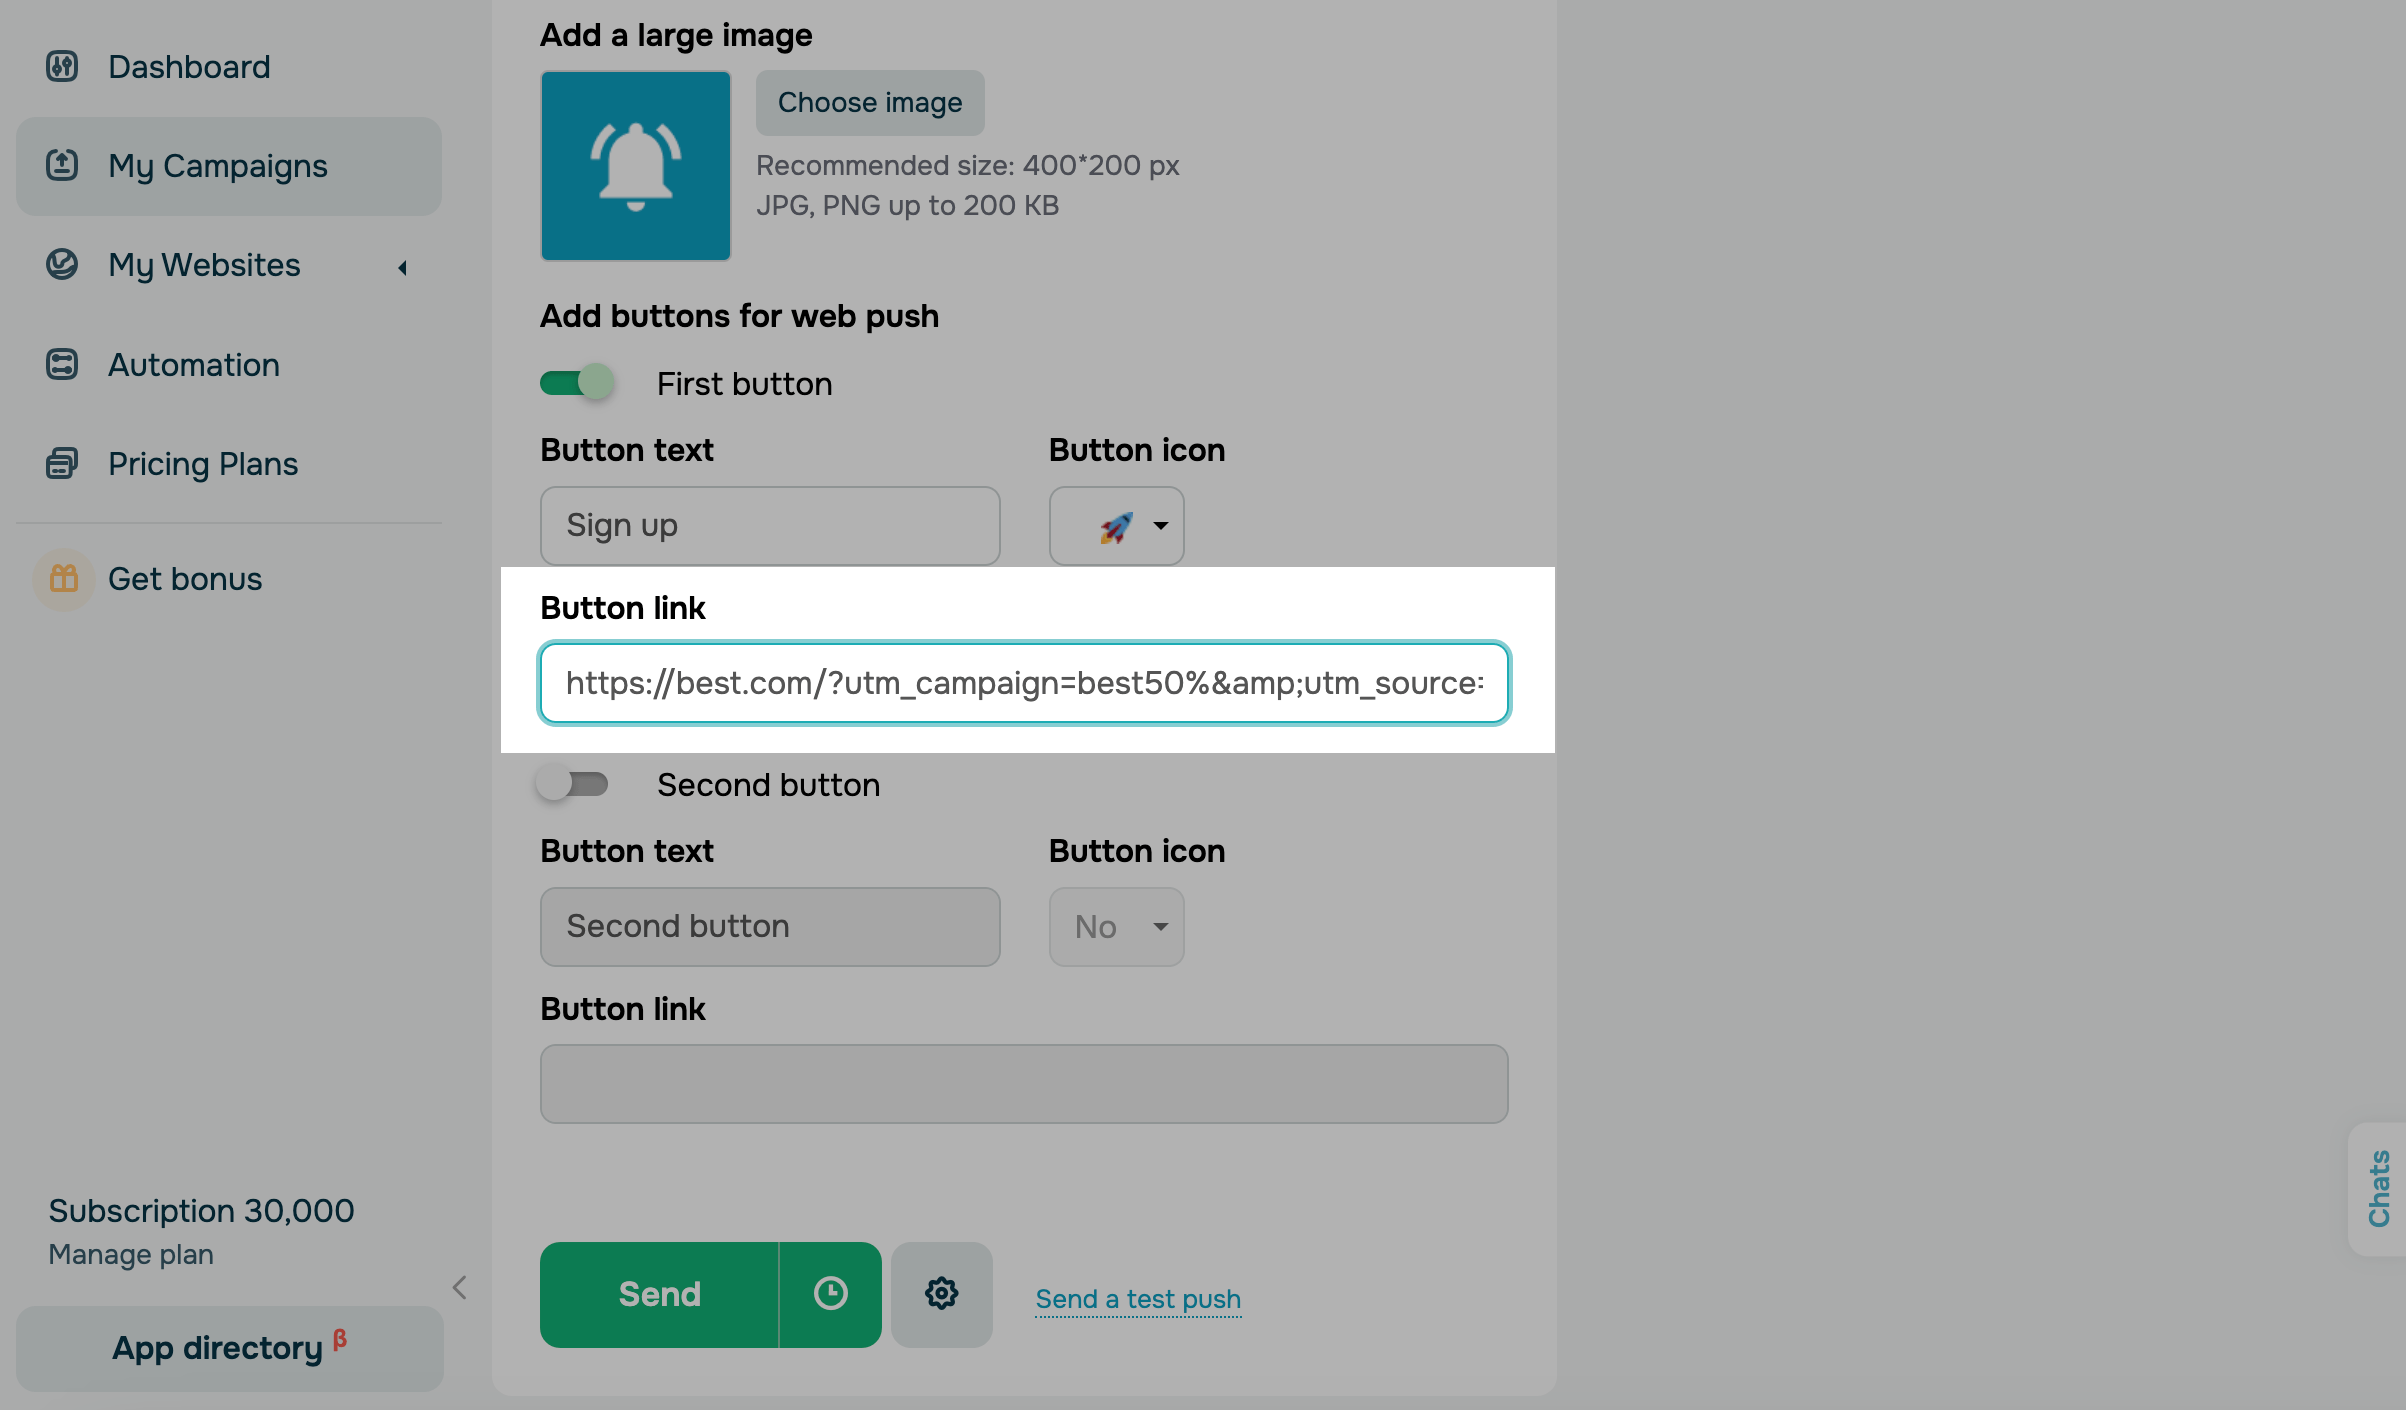
To add custom tags to a link, enter the link with the specified UTM tags in the Notification Link field.
To create a link manually, specify the full URL of the page to which your web push notification should lead, and put a question mark at the end of the page link. Specify UTM tags by linking them with the & sign.
Example:
https://best.com/?utm_campaign=best50%&utm_source=sendpulse&utm_medium=push
To create links automatically, use dedicated applications, for example:
UTM tag generator
URL Builder
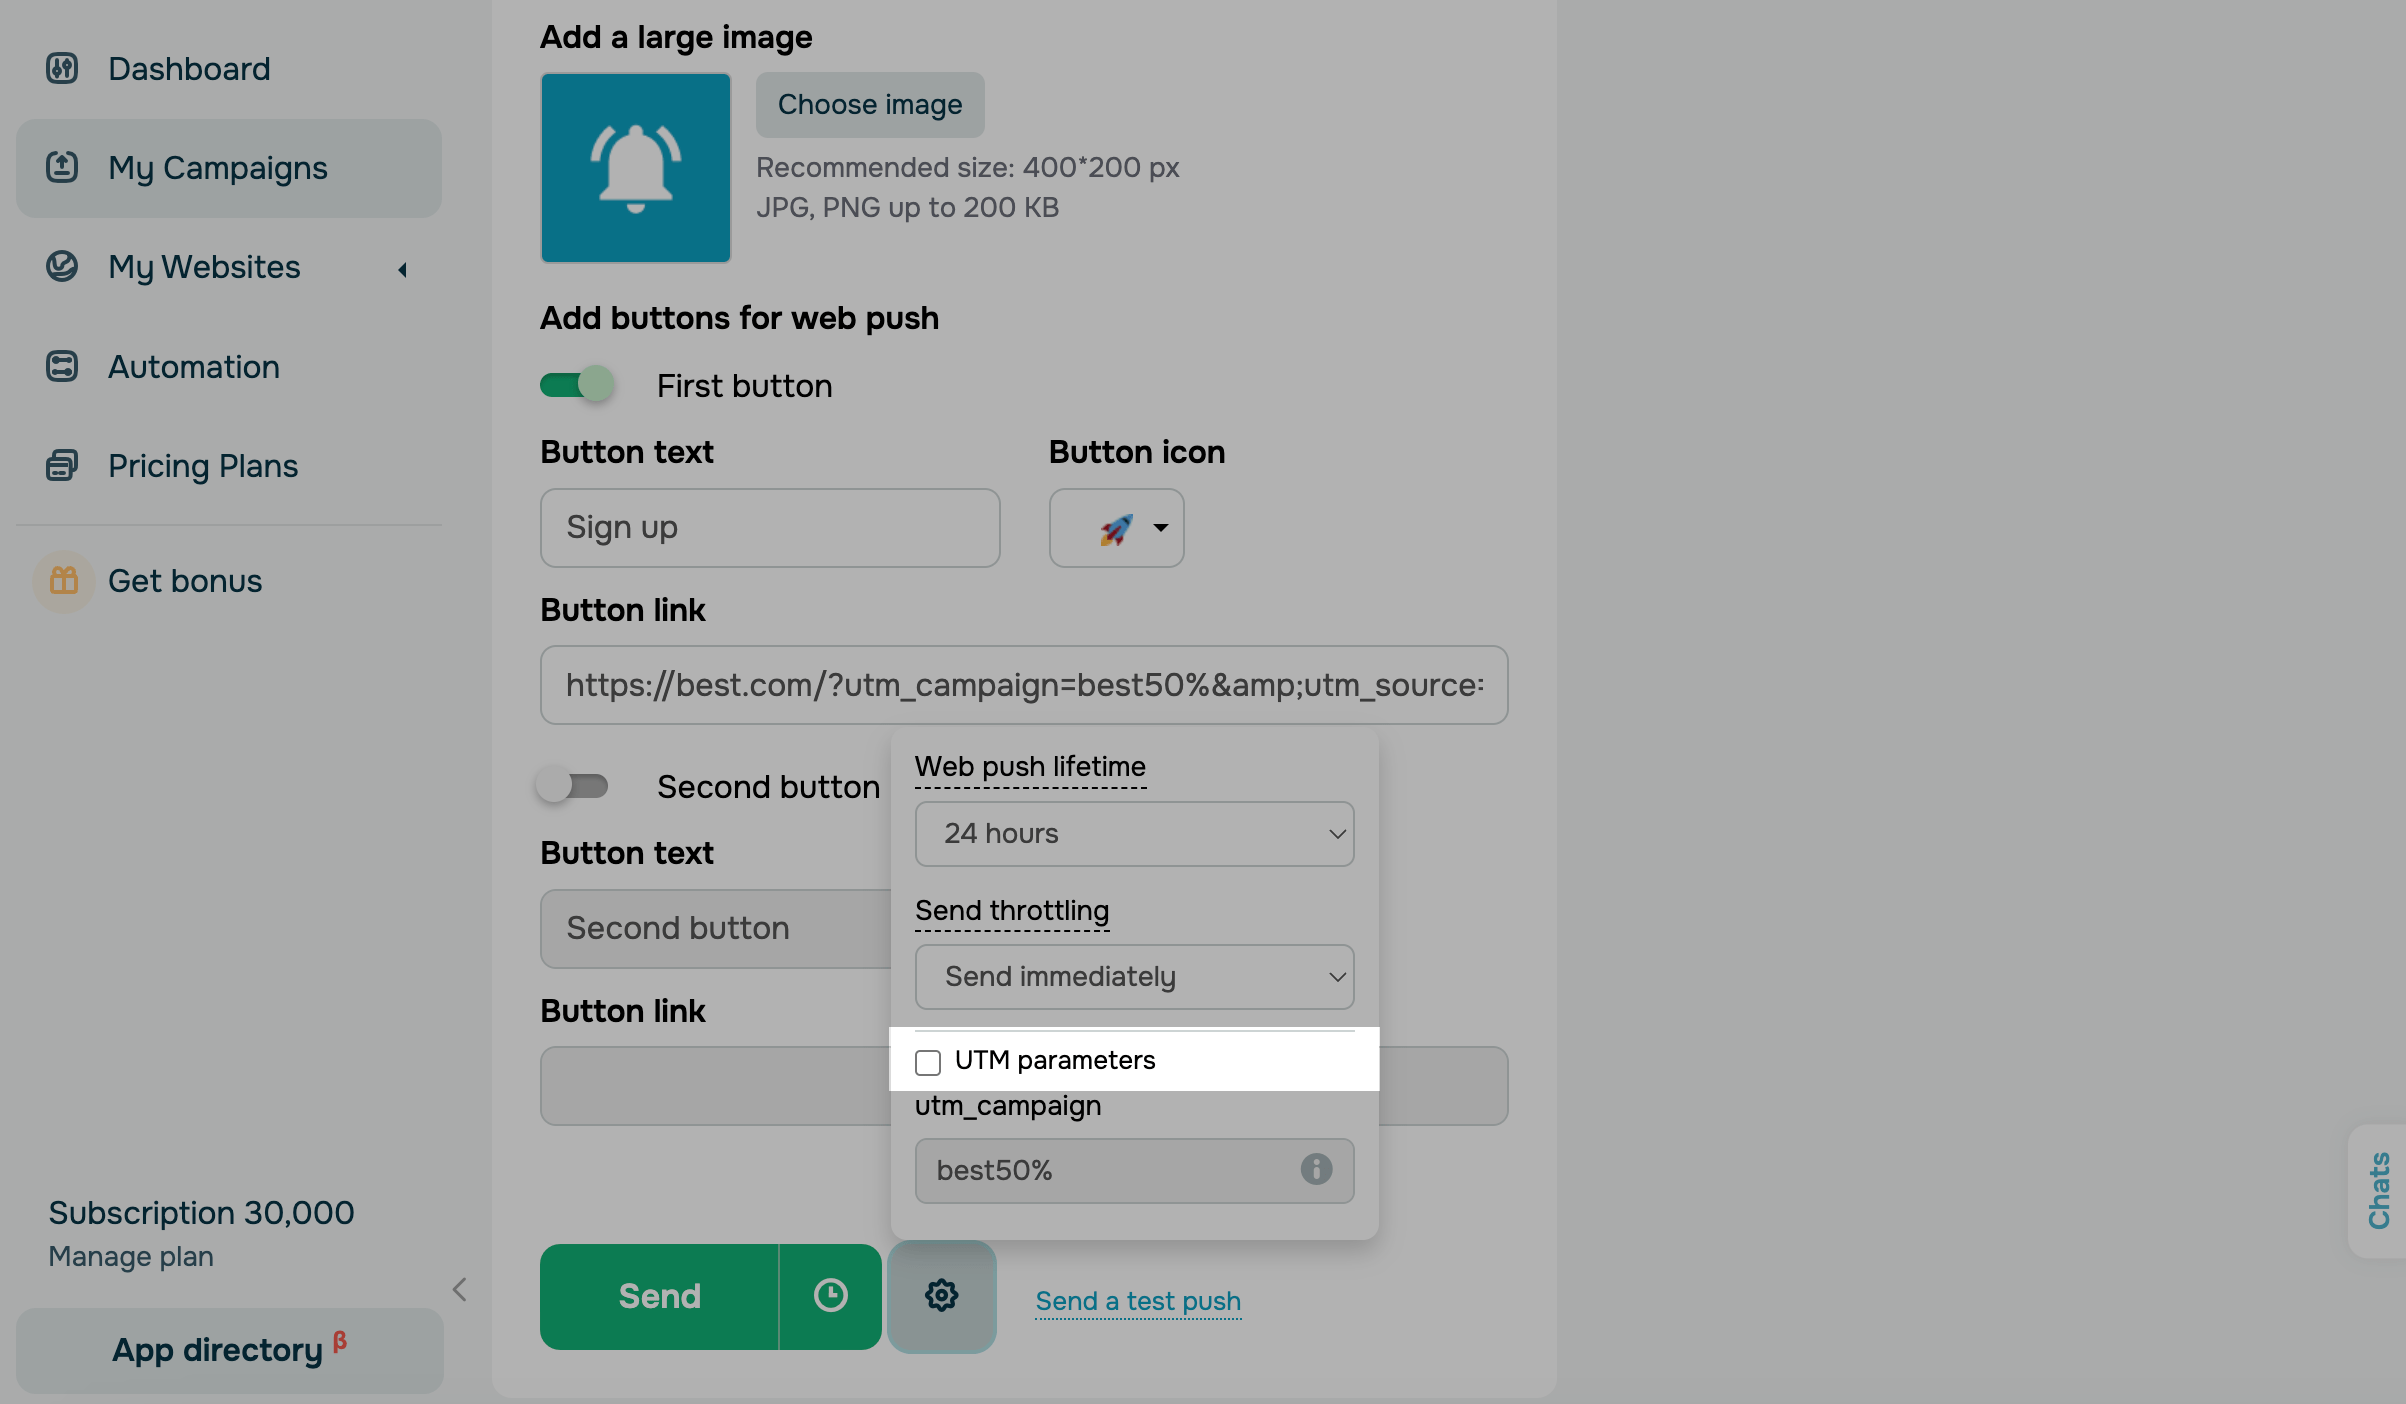
Make sure the UTM parameters are disabled.
Track your statistics
In your personal account
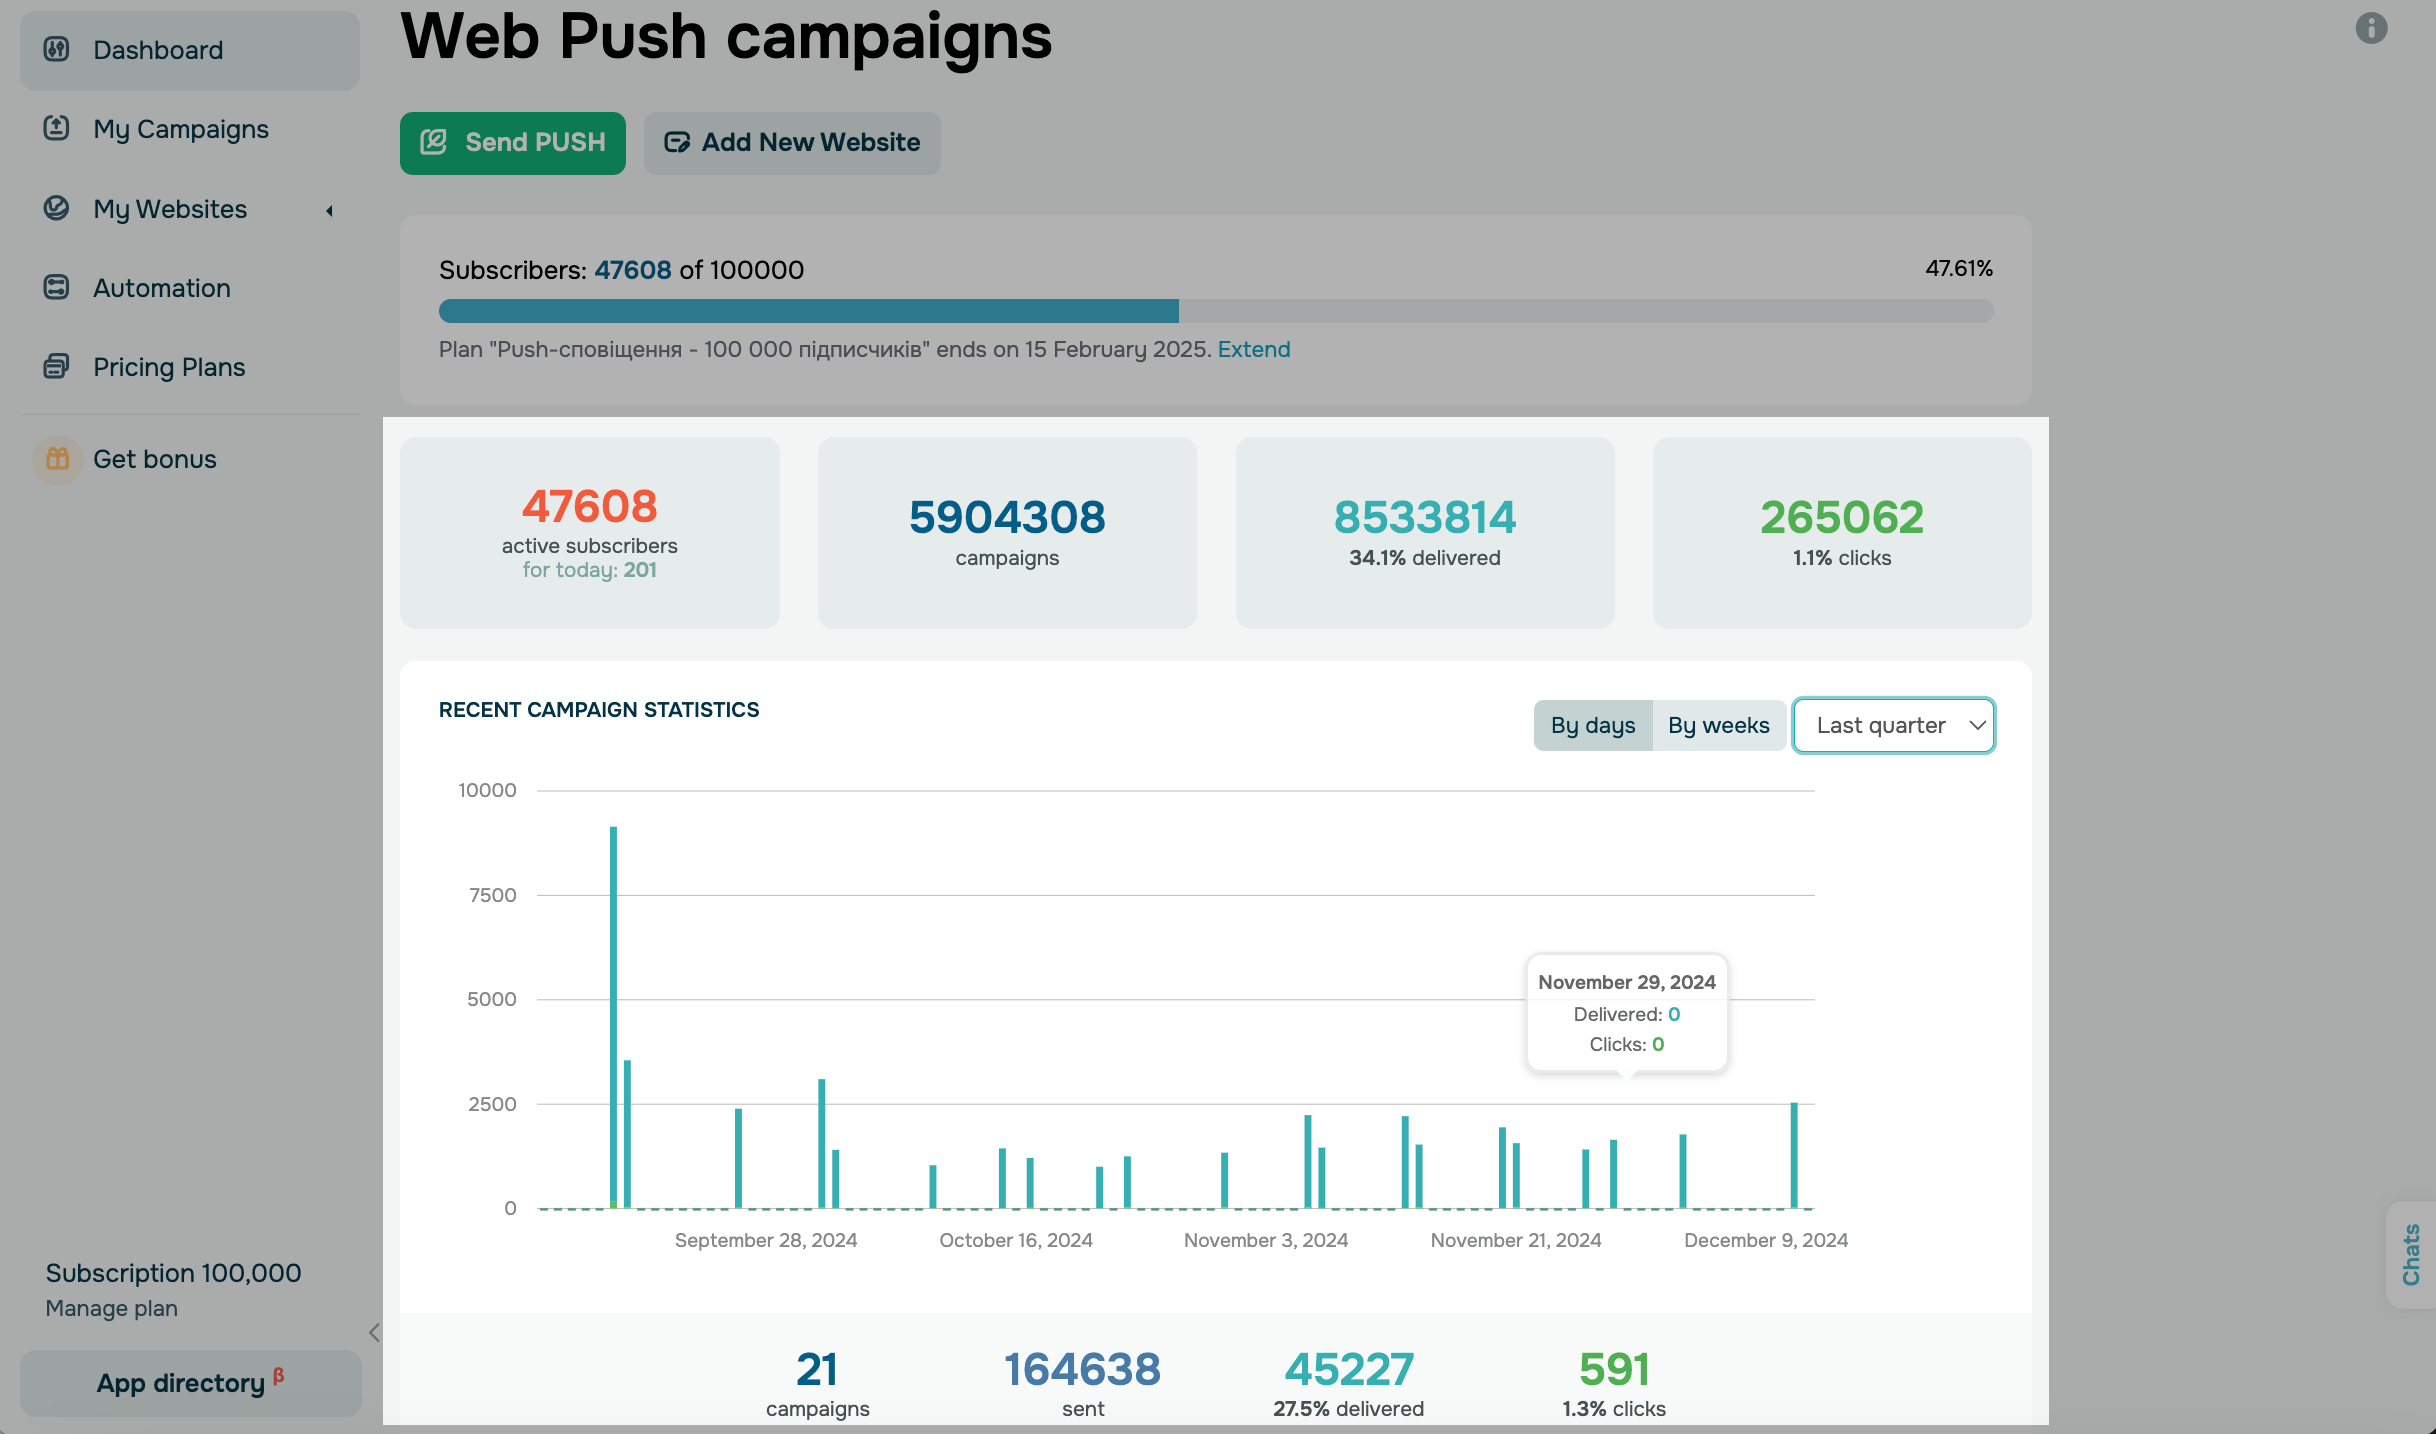
To view overall statistics for all web push campaigns, open the Push section, and go to the Dashboard tab. It contains information about your number of active subscribers, completed campaigns, delivered notifications, and click-throughs.
The graph displays the information about your campaigns for the current week, including dates and the number of campaigns, sent and delivered notifications, and click-throughs.
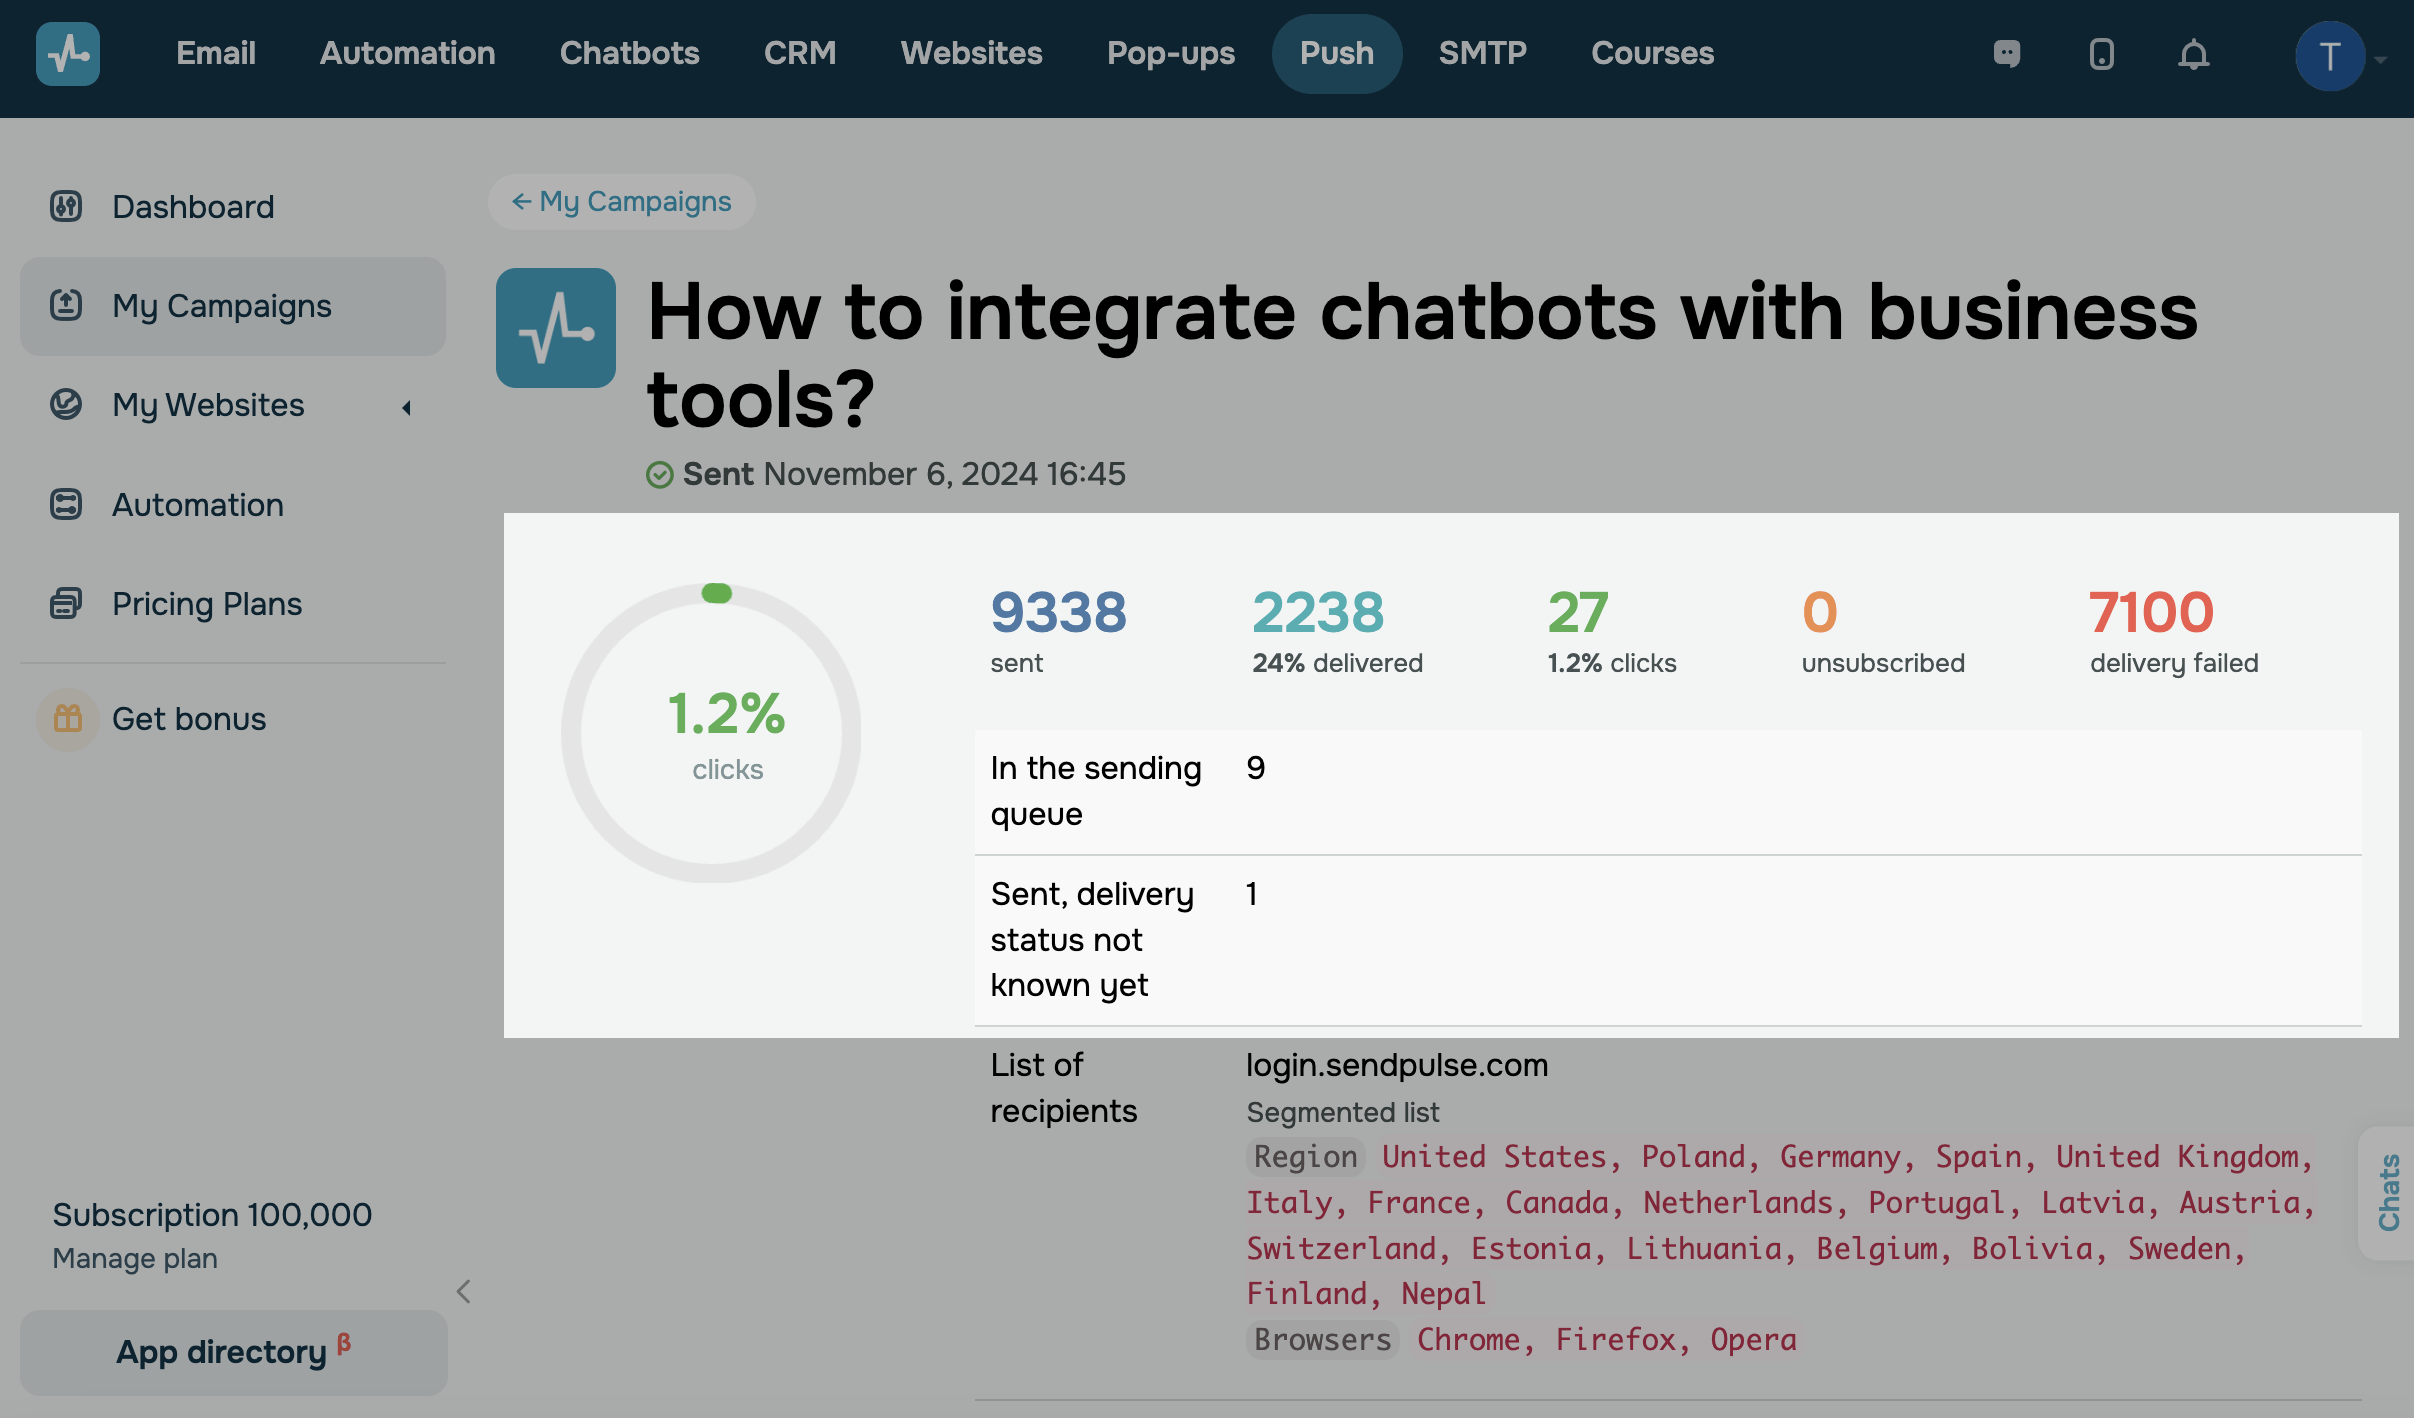
To view the information about a specific campaign, go to Push > My Campaigns. Choose a campaign from the list, and open it.
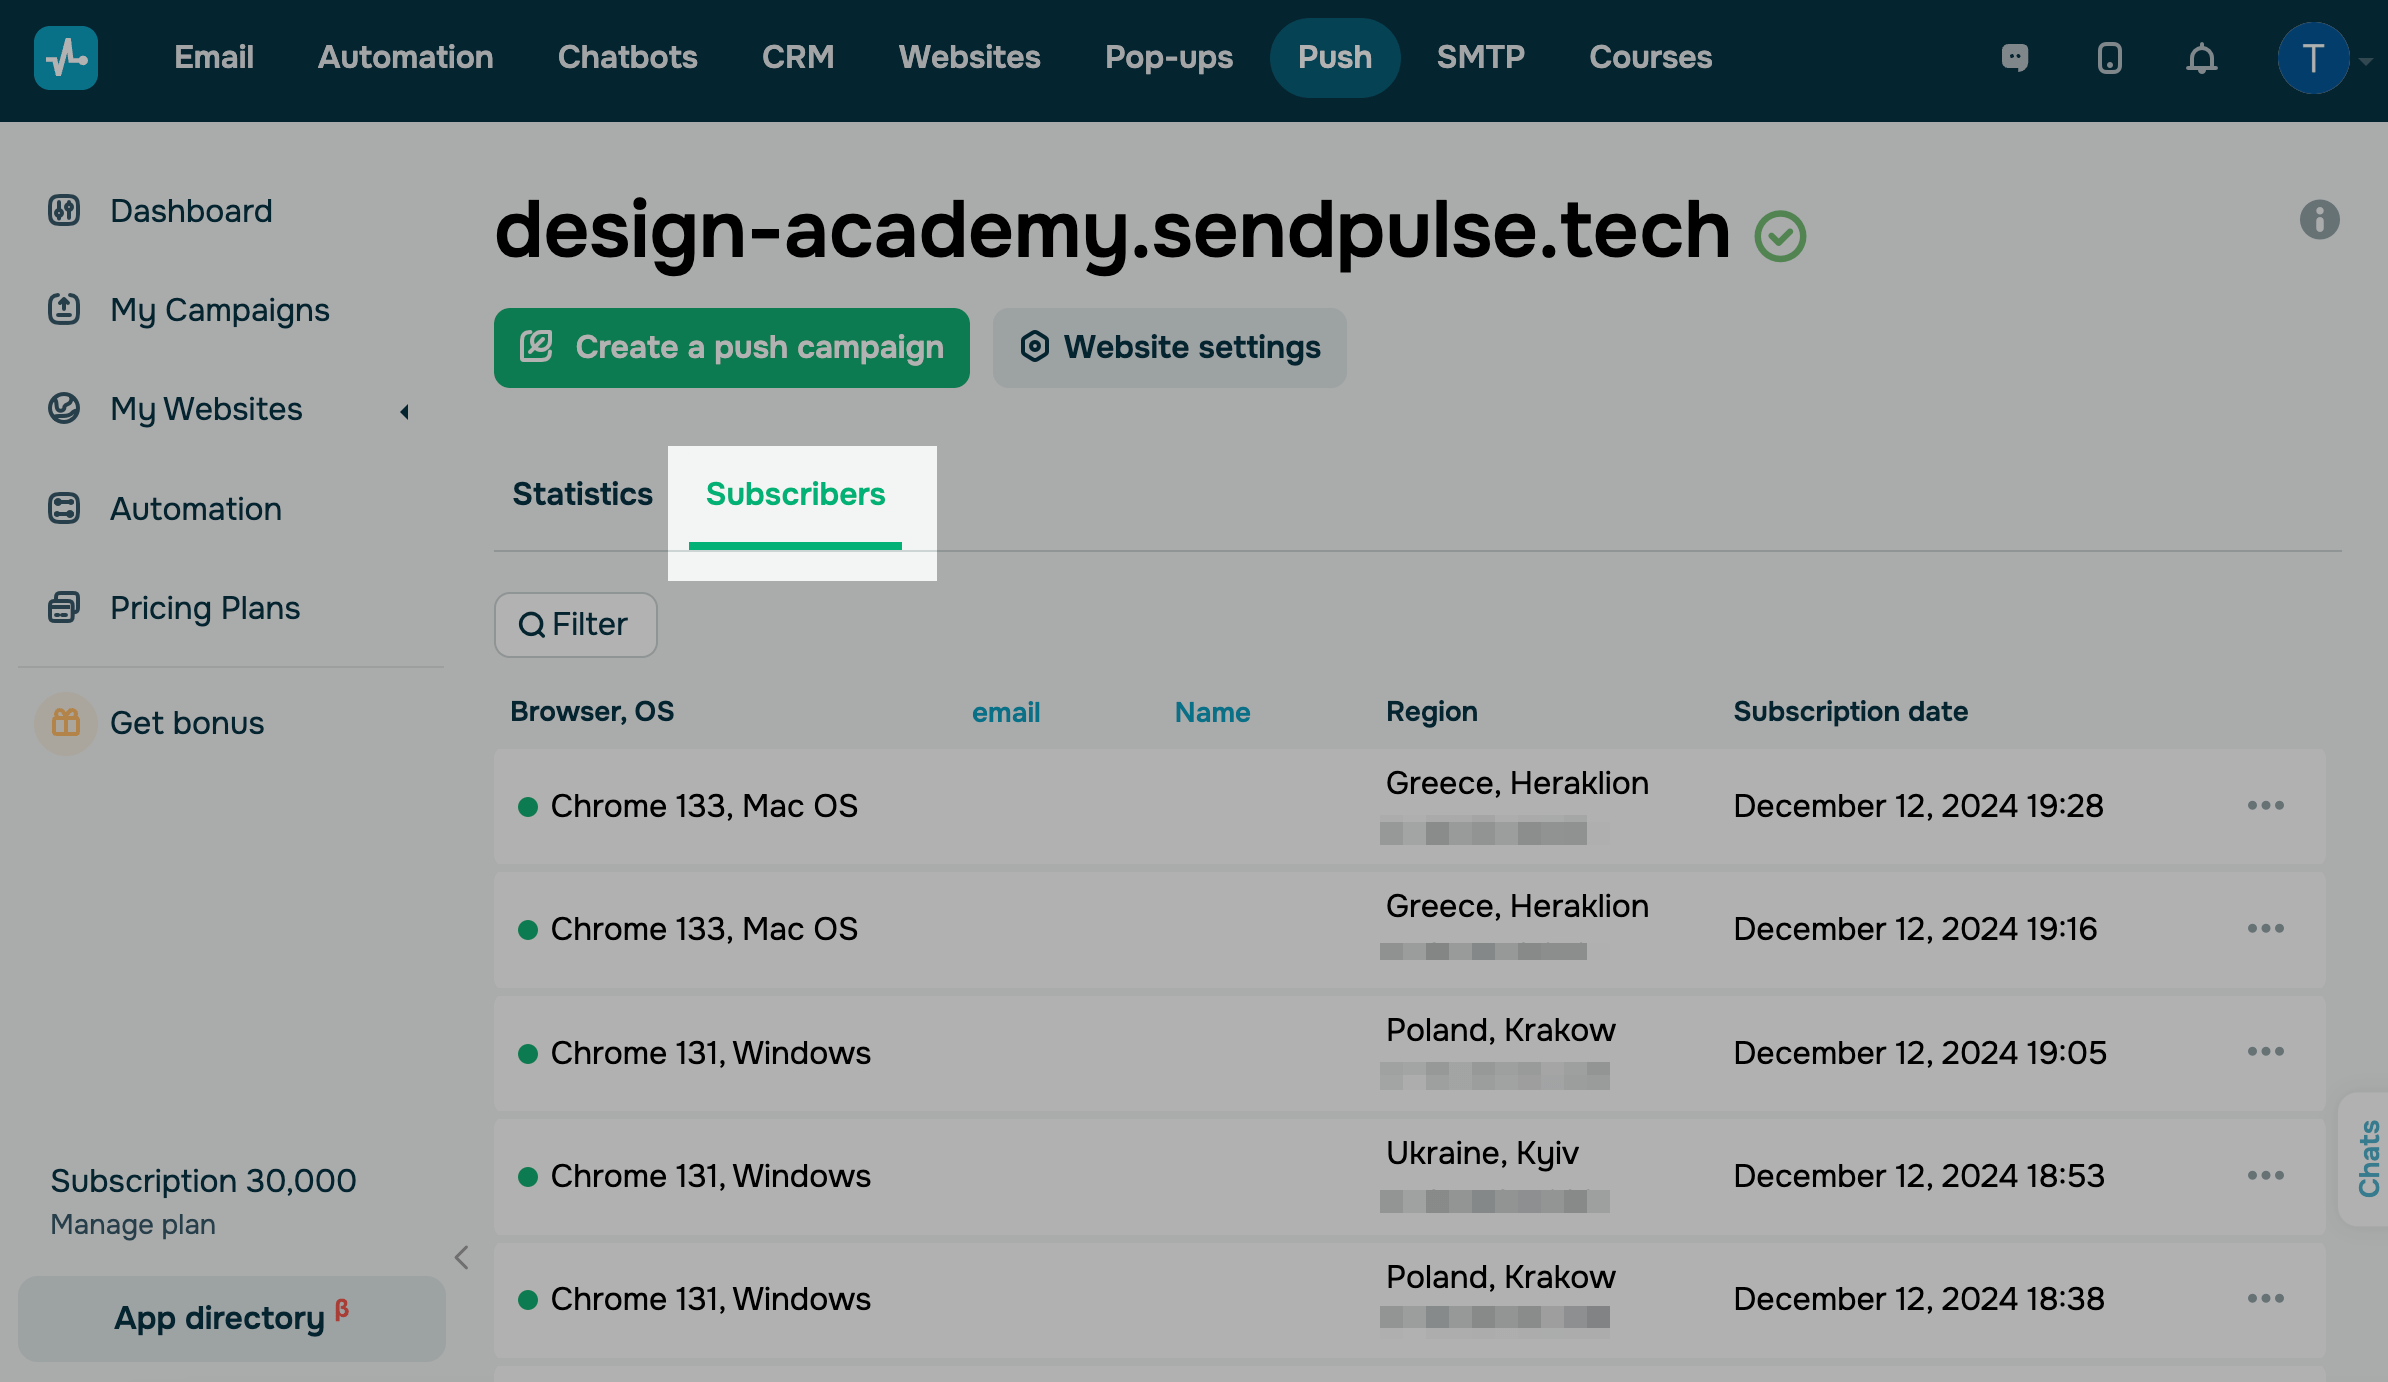
You can also find the information about browsers, OS, IP subscribers, and regions. To do this, go to Push > My Websites tab, and select a site. Open the Subscribers tab.
In Google Analytics
On July 1, 2023, standard Universal Analytics properties will stop processing data, and support for Analytics 360 properties will only continue until July 1, 2024. The supported and recommended version is Google Analytics 4.
If you have a Google Analytics counter installed on your website, you can also track your user and traffic acquisition in Google Analytics.
Log in to your Google Analytics account.
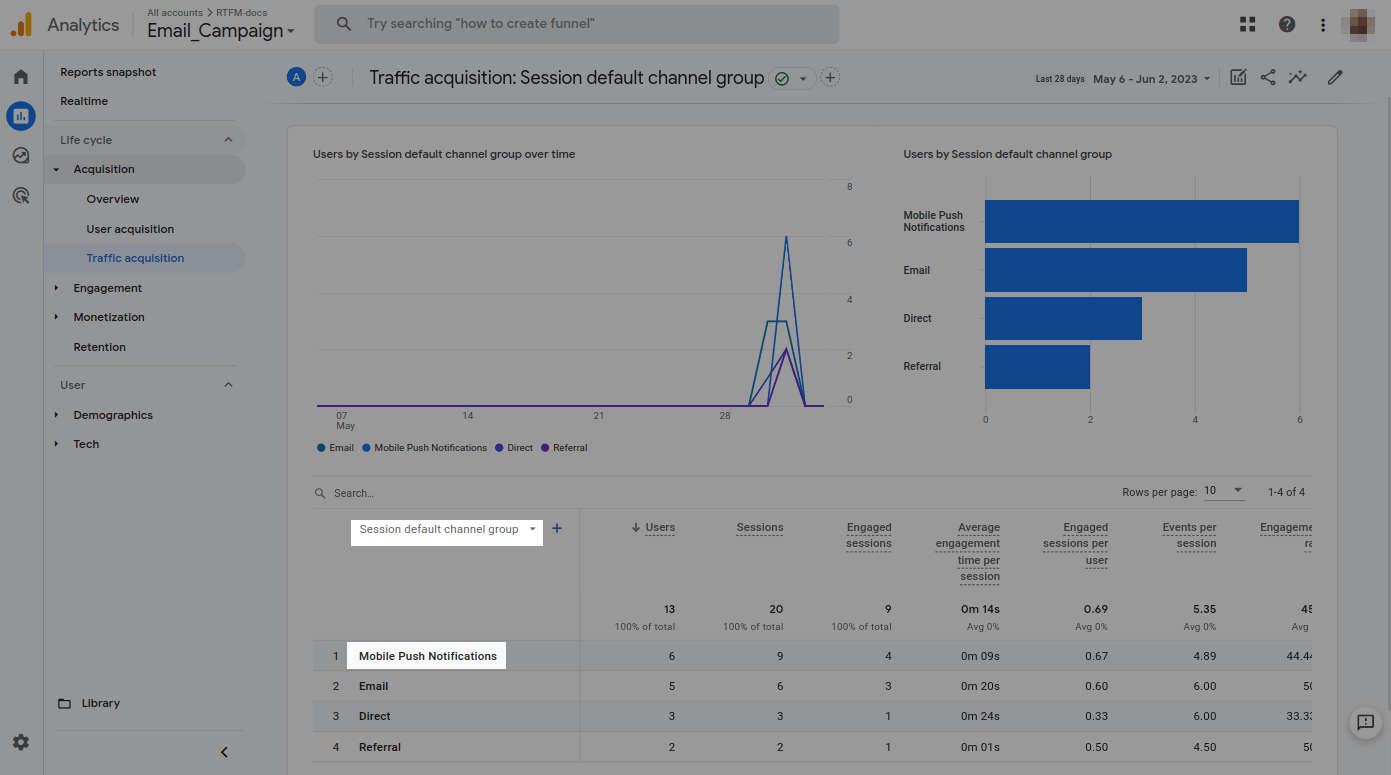
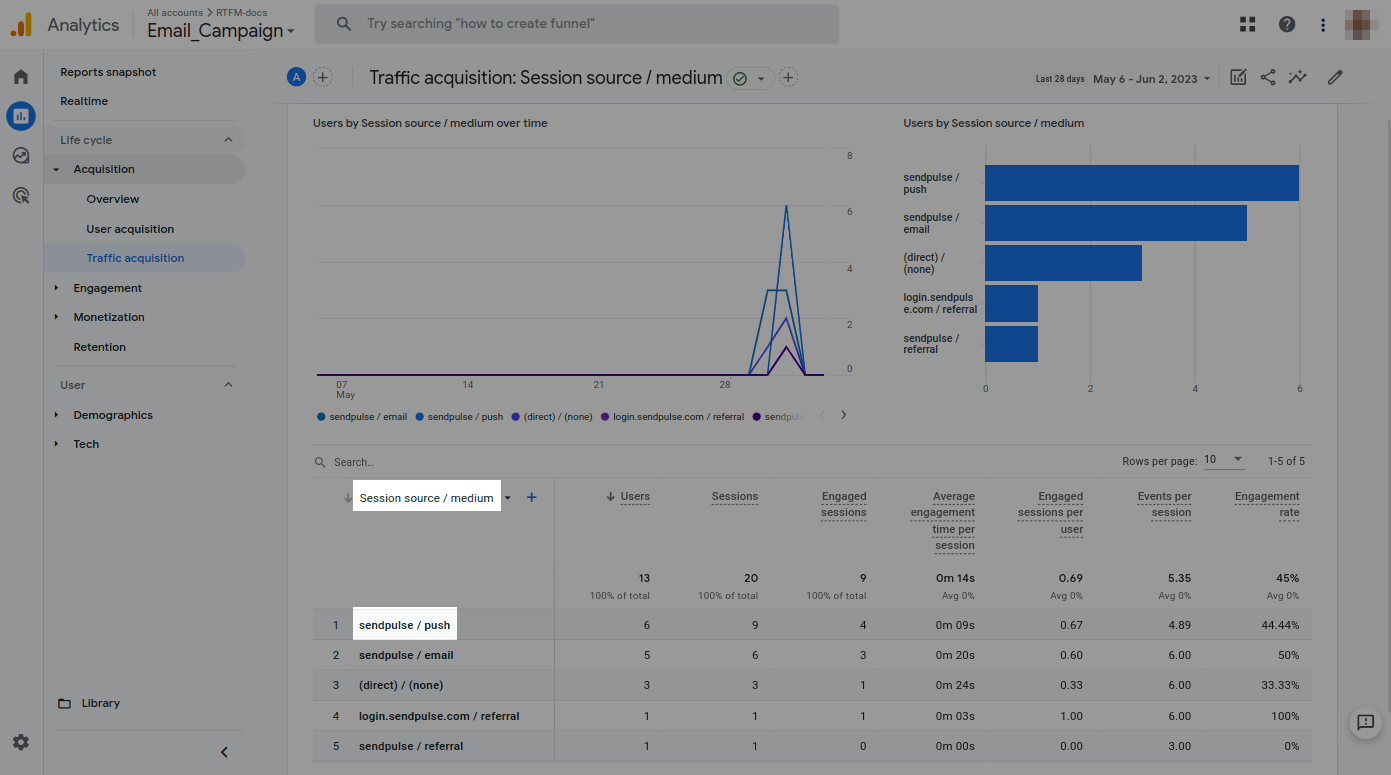
To see detailed statistics on click-throughs and user sessions, go to Reports > Life Cycle > Acquisition > Traffic acquisition.
In Acquisition > User acquisition, you can view your users’ demographic data.
The metrics in both sections are built on similar principles. To evaluate your email click-throughs, set Session default channel group as your key parameter, and analyze data from the Mobile push notifications section.
If you use multiple campaign tools and want to highlight only the SendPulse-generated campaigns, set Session source / medium to sendpulse / push.
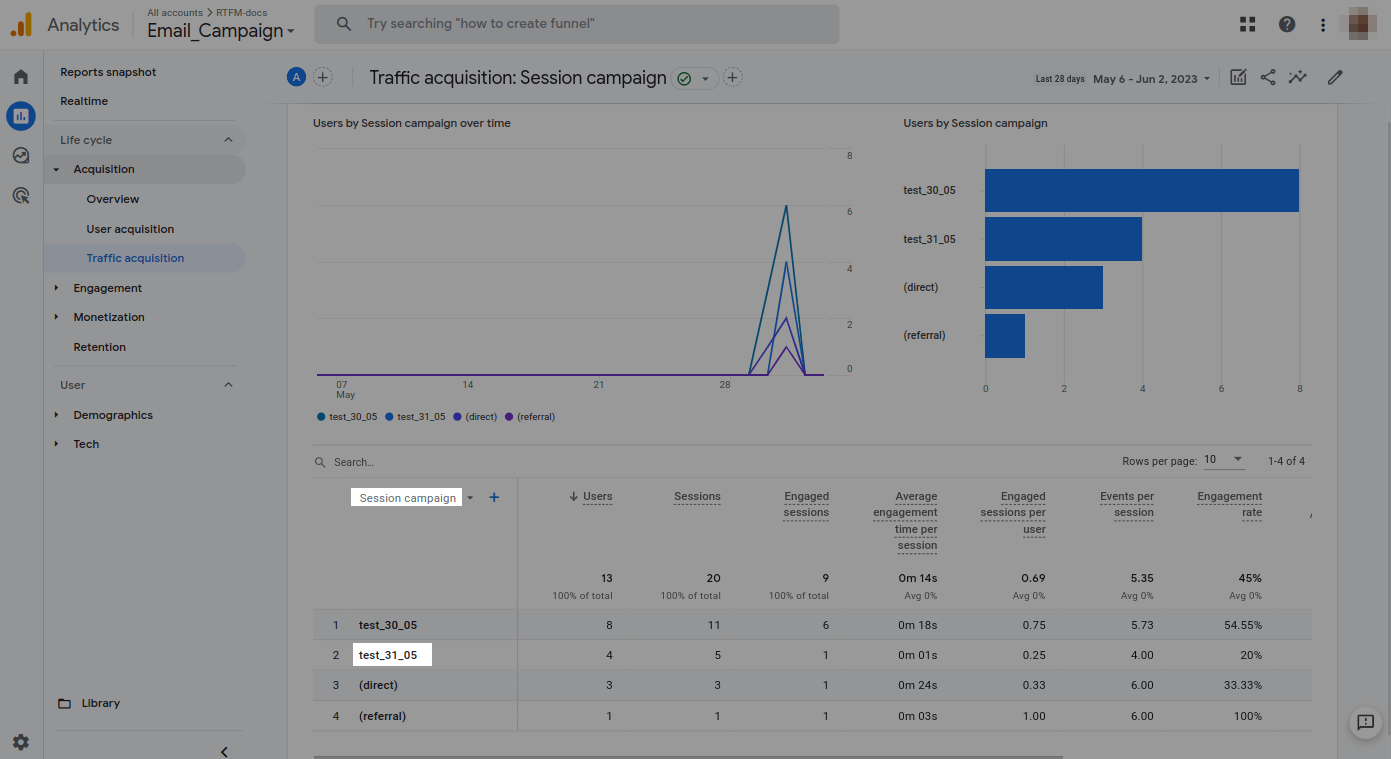
Select the Session campaign as your key parameter, and find the name that corresponds to your specified utm_campaign label to view campaign statistics.
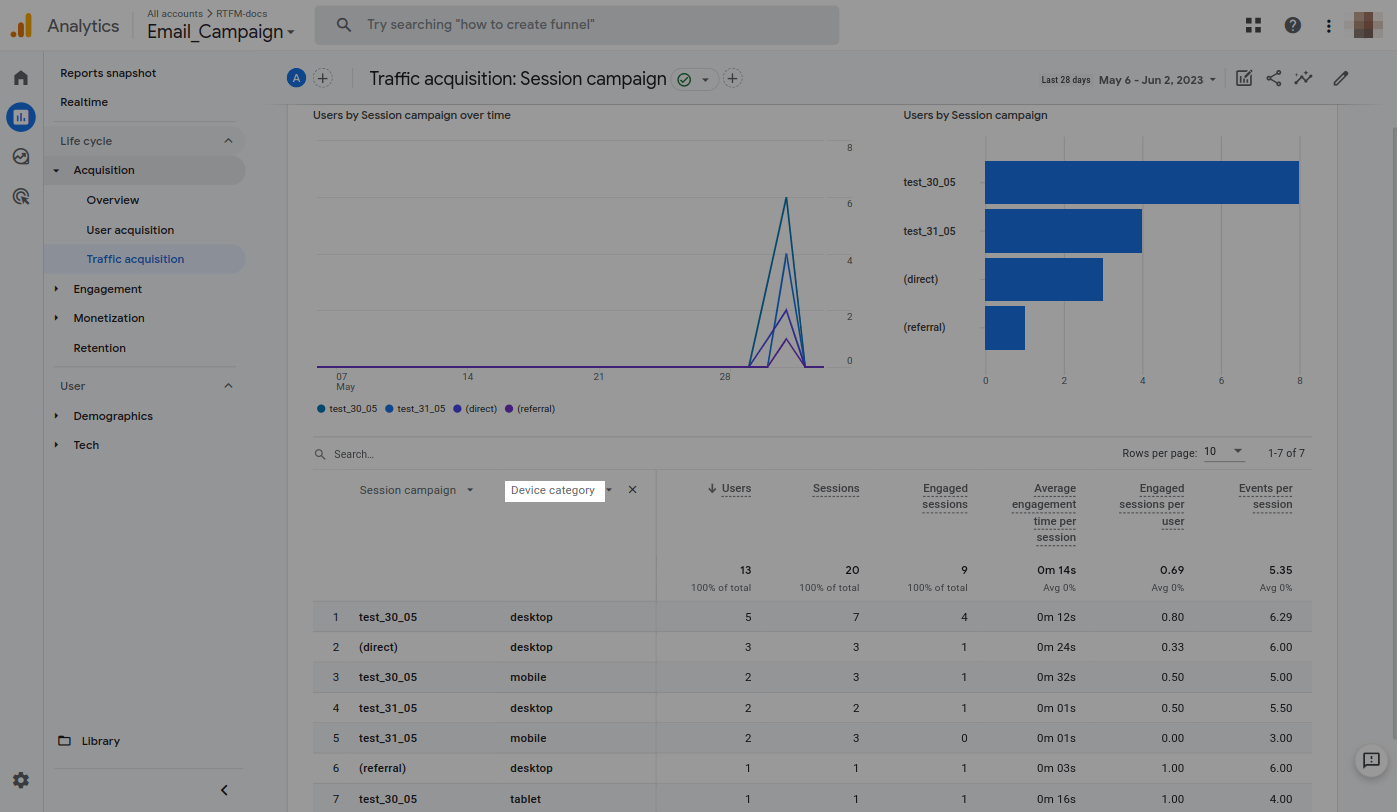
You can add another column of parameters for analysis. For example, to determine the kinds of devices from which users navigate to your site, click the + icon in the table header, and select Device category.
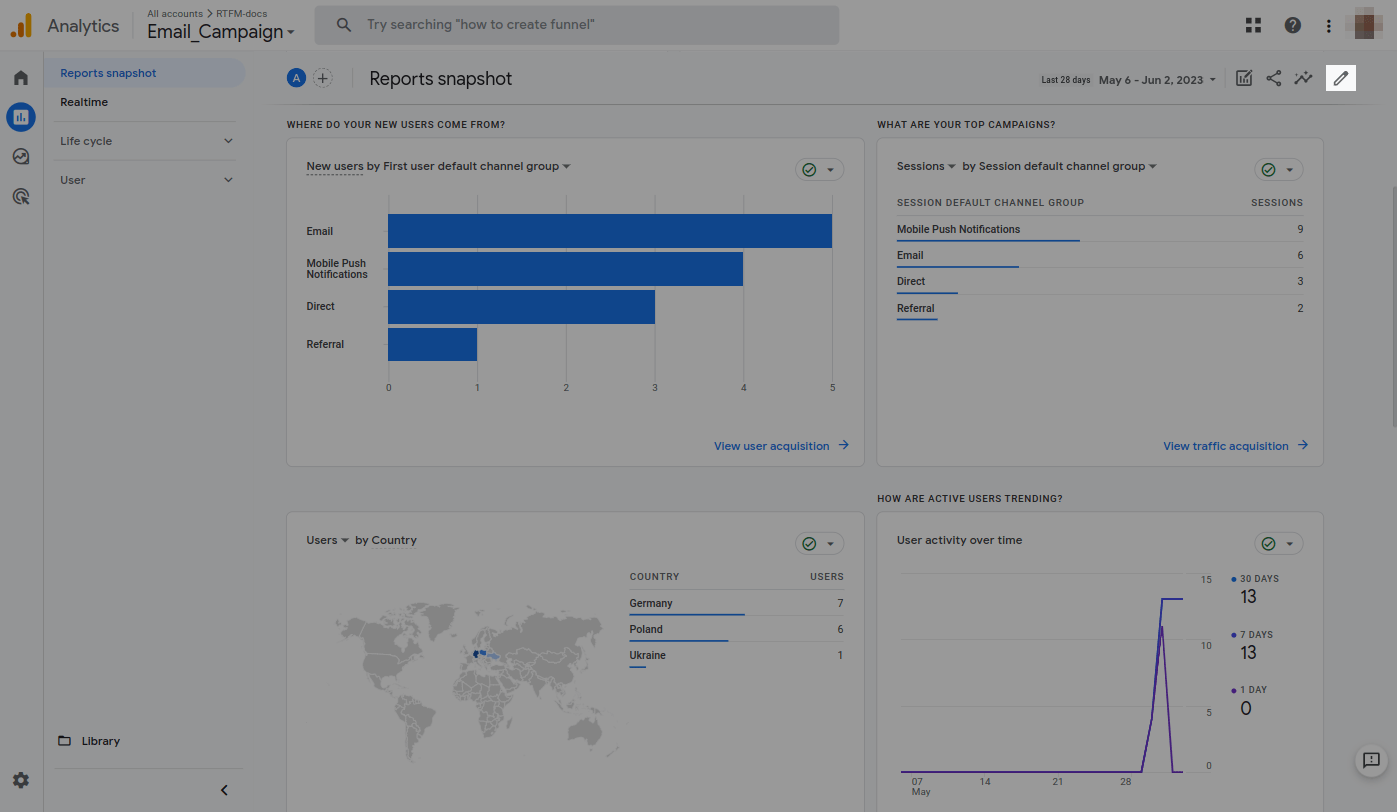
You can customize the output of all the metrics you want on the Reports snapshot page. For example, you can display metrics with data on traffic sources, campaign tags, and user geolocation and then move on to detailed analysis in the relevant sections.
To customize the metrics to be displayed, click the pencil icon in the upper right corner.
Google Analytics metrics can display different data depending on the settings. Check out the Google Analytics 4 documentation to better navigate the service settings.
Last Updated: 11.01.2024
or