Email marketing metrics are indicators that help assess the success of email campaigns. One can specify two categories: the first is standard engagement metrics, while the second category is focused on conversion aspects.
In this video, Alex dives deep into the world of email marketing metrics, shedding light on three crucial metrics every marketer should be tracking.
Why is it important to monitor email marketing metrics
Email is a customizable marketing channel, which makes it super-effective when developed smartly. Tailoring messages to buyer personas is simple, especially when one interprets email metrics correctly. Metrics provide useful data on current campaigns and may show approaches to solve existing problems.
Take a look at the metrics below. This is a list of the most influential factors one should consider when evaluating an email campaign.
Make your customers say 'YAAAS' with our blog's email hacks!
9 Most Important Email Marketing Metrics
- Email deliverability rate
- Email open rate
- Click-through rate
- Conversion rate
- Spam complaints
- Email bounce rate
- Unsubscribe rate
- Revenue per email
- List growth rate
Email Deliverability Rate
This is the vital metric for any marketer because it tells you whether your email makes it to recipients or not. The email deliverability rate represents the number of emails that reach the users’ inbox.
How to Calculate an Email Deliverability Rate
Number of emails delivered ÷ Number of emails sent
The following factors have an impact on this metric:
- IP address reputation and sender reputation;
- choice of an email service provider;
- mailing list quality;
- user engagement with your previous campaigns;
- spam-like words in the email subject line;
- spam complaints.
To find out how to eliminate these problems and increase your email deliverability, follow these tips.
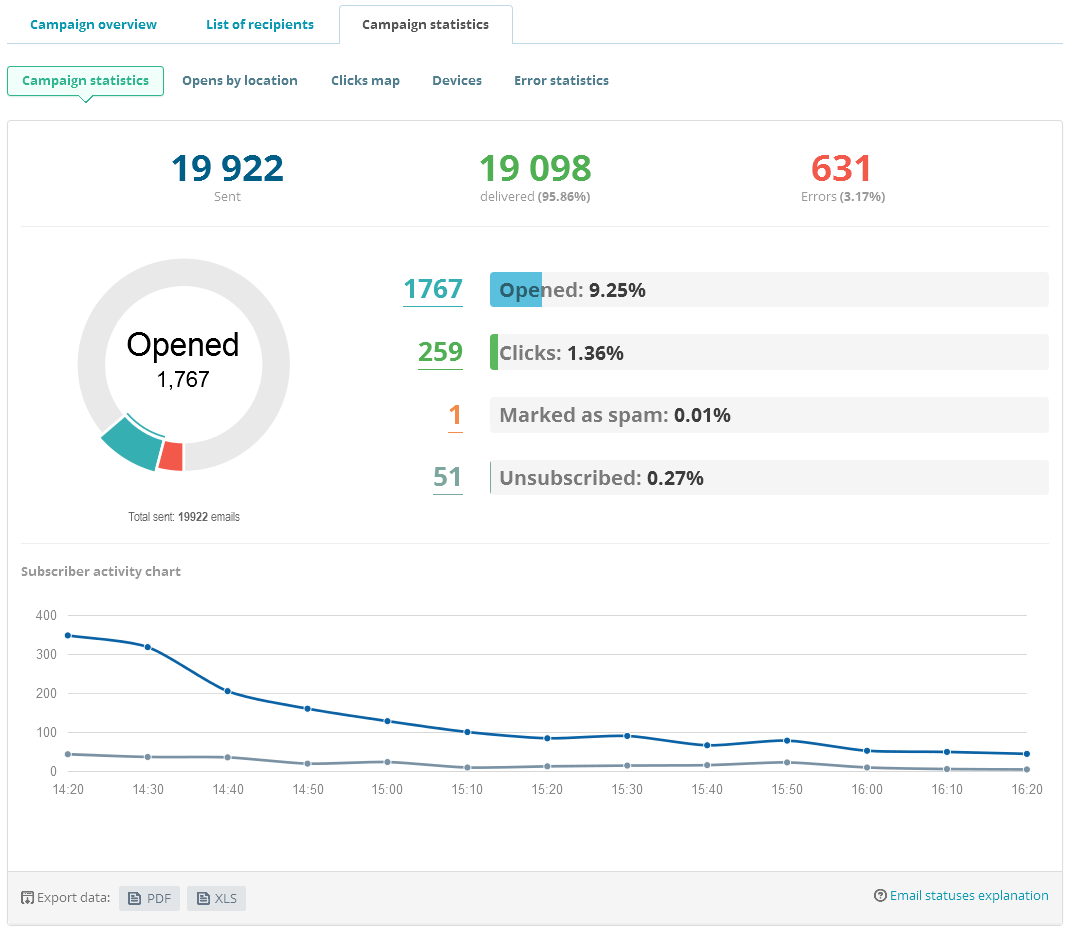
With SendPulse, you can monitor your email deliverability rate after sending a campaign.

Email Verifier allows marketers to check their mailing list and remove invalid email addresses. As a result, you'll increase your email deliverability and sender reputation.
Email Open Rate
This metric indicates the number of emails opened. A high open rate means that many people are interested in receiving your campaigns.
How to Calculate an Email Open Rate
Percentage of contacts who opened an email ÷ Number of users the message was sent to
The influential factors include:
- the field your business operates in;
- whether you are a B2B or B2C organization;
- mailing list segmentation;
- email subject line relevancy;
- email sending frequency and timing;
- sender authority.
When considering your email open rate, take into account opens by location to get a better picture of your strategy.
Track the email open rate after sending each campaign with SendPulse.

In this article, we’ve collected a list of tips that will help you improve your email open rates.
Click-Through Rate
This metric defines how many users clicked on the links inside an email. As Forbes fairly noticed, 64% of marketing experts agree that their top priority is to increase their click-through rate. The click-through rate may show whether a business has to boost email marketing and sales conversion rates.
How to Calculate a CTR?
(Total clicks ÷ Number of delivered emails)×100
The factors that impact click-through rate involve:
- mailing list segmentation;
- imagery;
- ad positioning;
- CTA prominence;
- content quality.
To improve the CTR of your email campaigns, follow these 13 tips.
Check out your email CTR with the SendPulse reports.

Conversion Rate
The conversion rate is the percentage of recipients who clicked on a link and did what the sender was expecting them to do. For example, they ended up buying your product. This metric depends on the open and click-through rate – it is the third stage of a buyer journey.
How to Calculate an Email Conversion Rate?
(Number of users who took the expected action ÷ Total emails delivered)×100
The factors that influence conversion rate are:
To measure the conversion rate, you need to integrate your email service with an analytic system.
SendPulse allows to track statistics using Google Analytics. Find out more.
Spam Complaints
Those are so-called spam complaints that users may send to the server. You should pay attention to these because they have a negative impact on both the email campaign and your sender reputation. This metric shows the chances of a sender being blocked by an email provider.
There is no special formula, the service provider usually tracks and displays the spam complaint rate to a sender. SendPulse provides this information after a campaign is sent.

The factors that influence this metric include the following:
- illegal list-building tactics;
- single opt-in subscription form;
- spammy words in a subject line and spam-like email content;
- high email sending frequency;
- poor email content;
- absence of an unsubscribe link;
- easily recognizable email sender name.
Here you’ll get to know how to send bulk emails without spamming.
SendPulse takes measures to keep its users’ reputation high and provides an email spam checker.
Email Bounce Rate
The bounce rate is a metric that shows whether a message was or was not delivered to the recipient. There are two types of bounces: soft bounce and hard bounce.
Your total bounce rate should not exceed 2%. Also, understand the difference between hard and soft bounces. The first occurs when an email could not be delivered for permanent reasons, while the second one means that messages could not be sent due to the temporary circumstances. Find out more in this article.
How to Calculate an Email Bounce Rate
(Number of bounced emails ÷ Number of all emails sent)×100
The major factors that impact this metric include:
- the large size of an email;
- invalid email address;
- inconsistent email sending;
- no SPF and DKIM signatures.
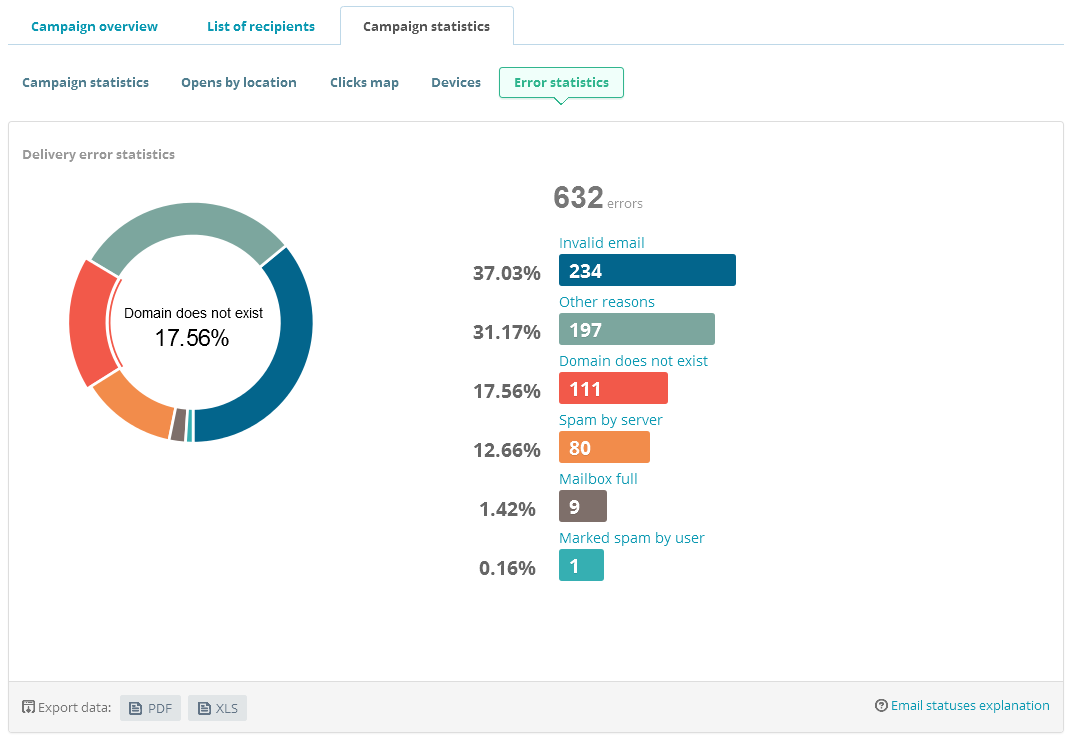
You can find bounces along with their causes in the “Error statistics” tab in your SendPulse account.

Unsubscribe Rate
This metric defines how many users lost interest in your emails for different reasons and you may need to target another audience or change something in the existing offer. Unsubscribe rate is, perhaps, the simplest metric to evaluate. Contact your email service provider to get this information or check email analytics at your email service. After that, you’ll have to fine-tune your subscribers by segmenting your mailing list.
How to Calculate an Unsubscribe Rate?
(Unsubscribed numbers ÷ Email delivered)×100
Factors that make users unsubscribe include:
- poor mailing list segmentation;
- high email sending volume;
- lack of unsubscribe link.
After sending an email campaign with SendPulse, you can track this metric in campaign analytics.

Revenue per Email
This is the most critical indicator as it demonstrates the overall performance of the emails: were they successful or not? With this email marketing metric, you can find out which types of emails work best for your business and develop your strategy accordingly.
How to Calculate Revenue per Email
Total income generated by the campaign ÷ Number of all emails that were successfully delivered
This metric depends on both, your overall email marketing strategy, and the quality of your list.
List Growth Rate
This metric tracks the rate at which your mailing list grows. It may show how to engage subscribers and make them more loyal.
How to Calculate List Growth Rate?
(Number of new subscribers − Number of unsubscribers)÷ Total number of email addresses on a list × 100
Do you find that some of these metrics do not satisfy you at all? Try sending your campaigns via email marketing services like SendPulse. They allow you to keep track of crucial metrics and improve them on the go.


or