Track your email campaign statistics in SendPulse
With SendPulse, you can track your email campaign results to better understand your target audience and tailor your marketing strategy. Monitor your delivered and opened emails, click-throughs, email open rate, users’ location and device types.
In this article, we will talk about how to collect and track statistics in your SendPulse and Google Analytics 4 accounts.
Create an email campaign
Start creating a campaign. Fill in the fields in Information about campaign section during the first step (campaign name, mailing list, sender email address, sender name, and subject line).
During the second step, in Message content section, select, upload, or create a template, and enter your text.
Read more: How to send an email campaign and How to create your own template.
Enable email statistics collection
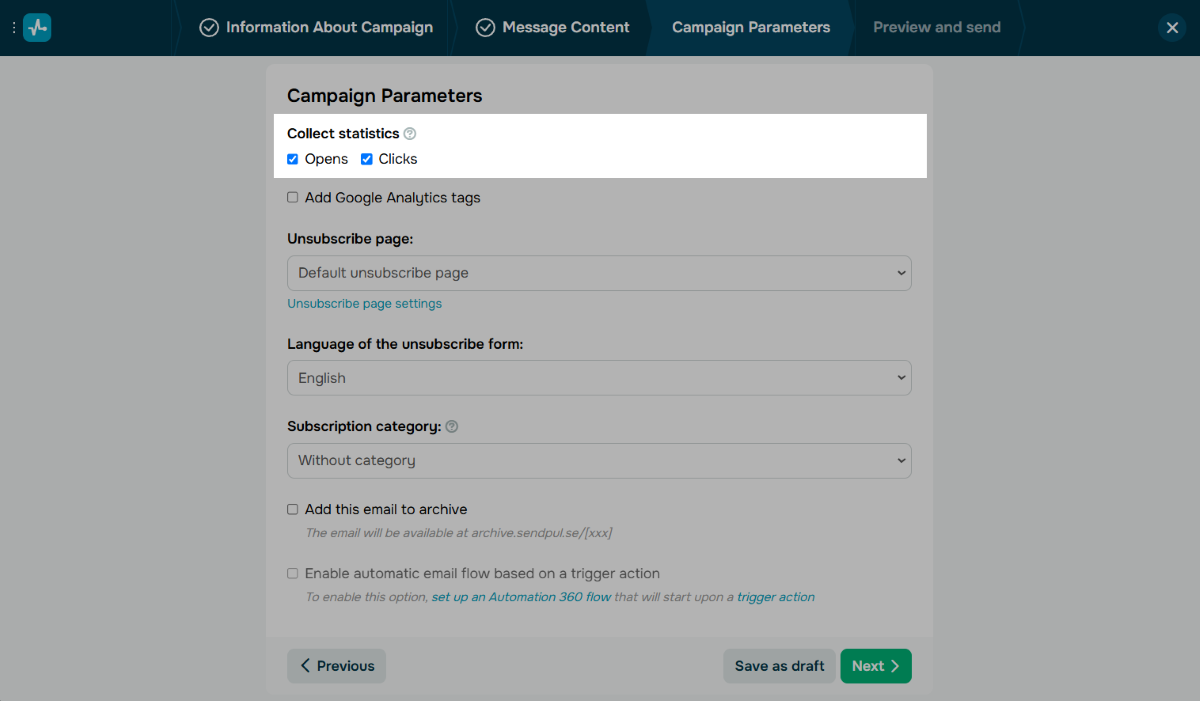
During the third step of creating your campaign, in Campaign parameters > Collect statistics section you can select the Opens and Clicks checkboxes.
Tracking links are valid for 1 year. Afterward, tracking stops and links become inaccessible.
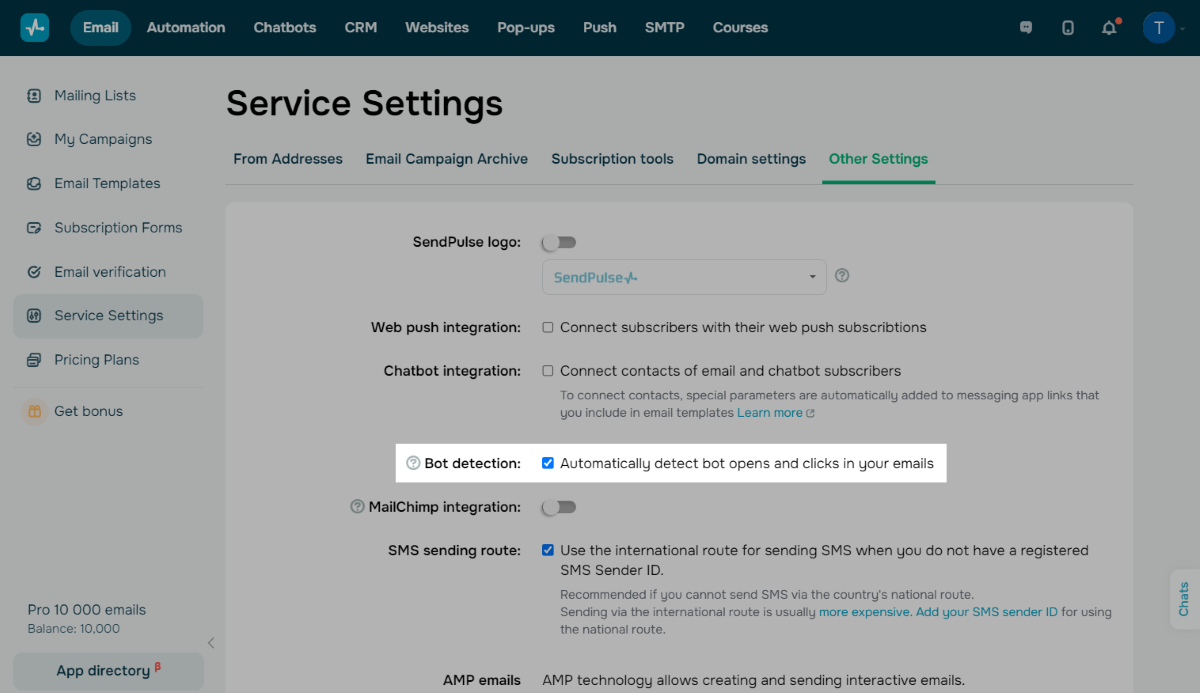
Using the Bot detection feature, you can track emails that were potentially opened and clicked through by bots.
To enable bot detection, go to Service Settings > Other Settings, and select the Automatically detect bot opens and clicks in your emails checkbox.
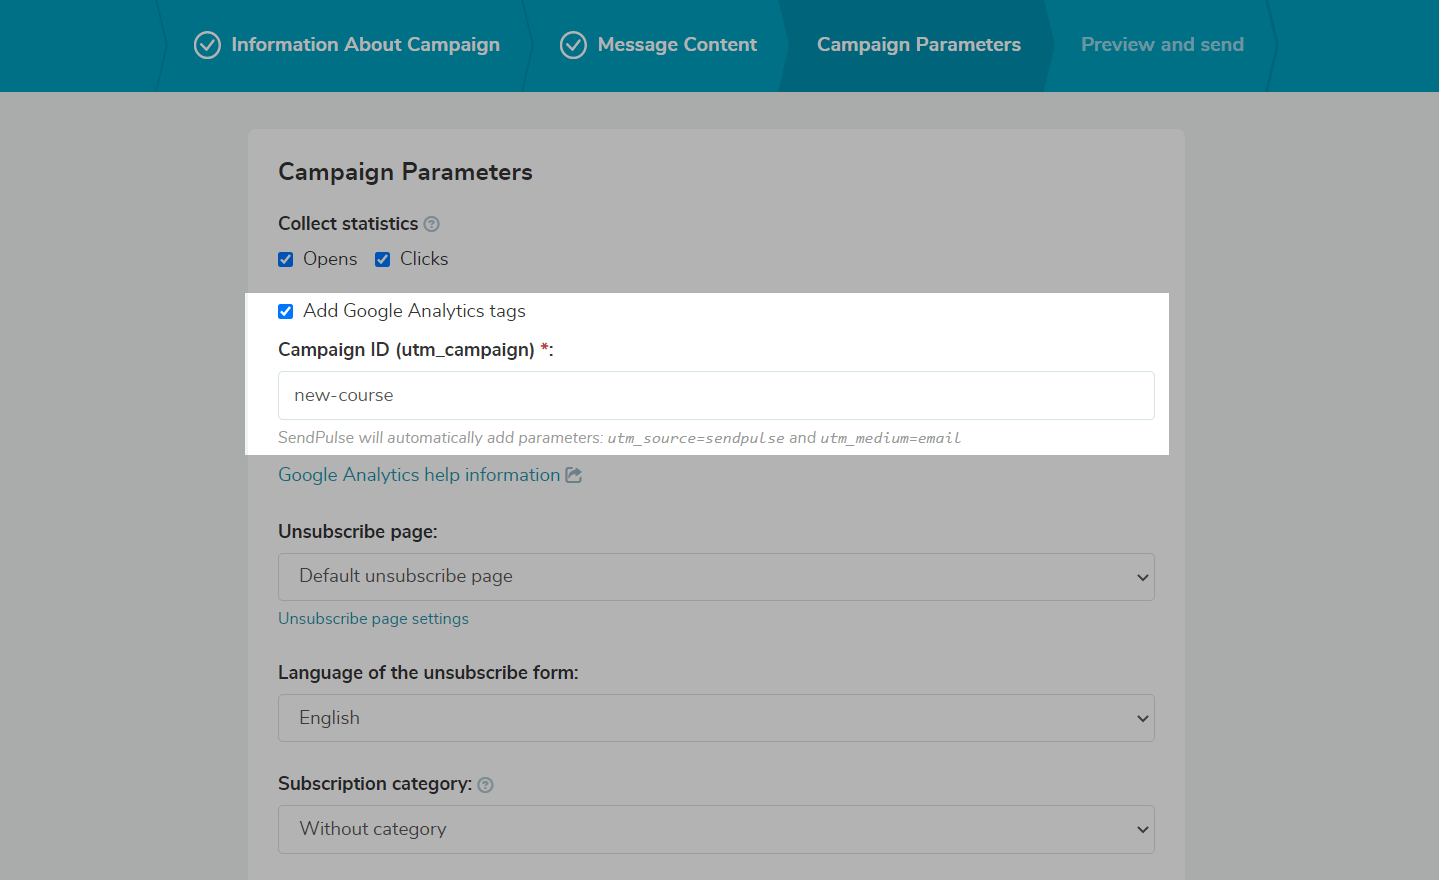
To track statistics in Google Analytics, select the Add Google Analytics tags checkbox, and enter a campaign name.
The utm_campaign tag is your campaign name, and you can use it to find your campaign details in Google Analytics. The utm_source and utm_medium tags are added automatically.
Track your statistics
In your SendPulse account
Customer activity
Go to Emails > My Campaigns.
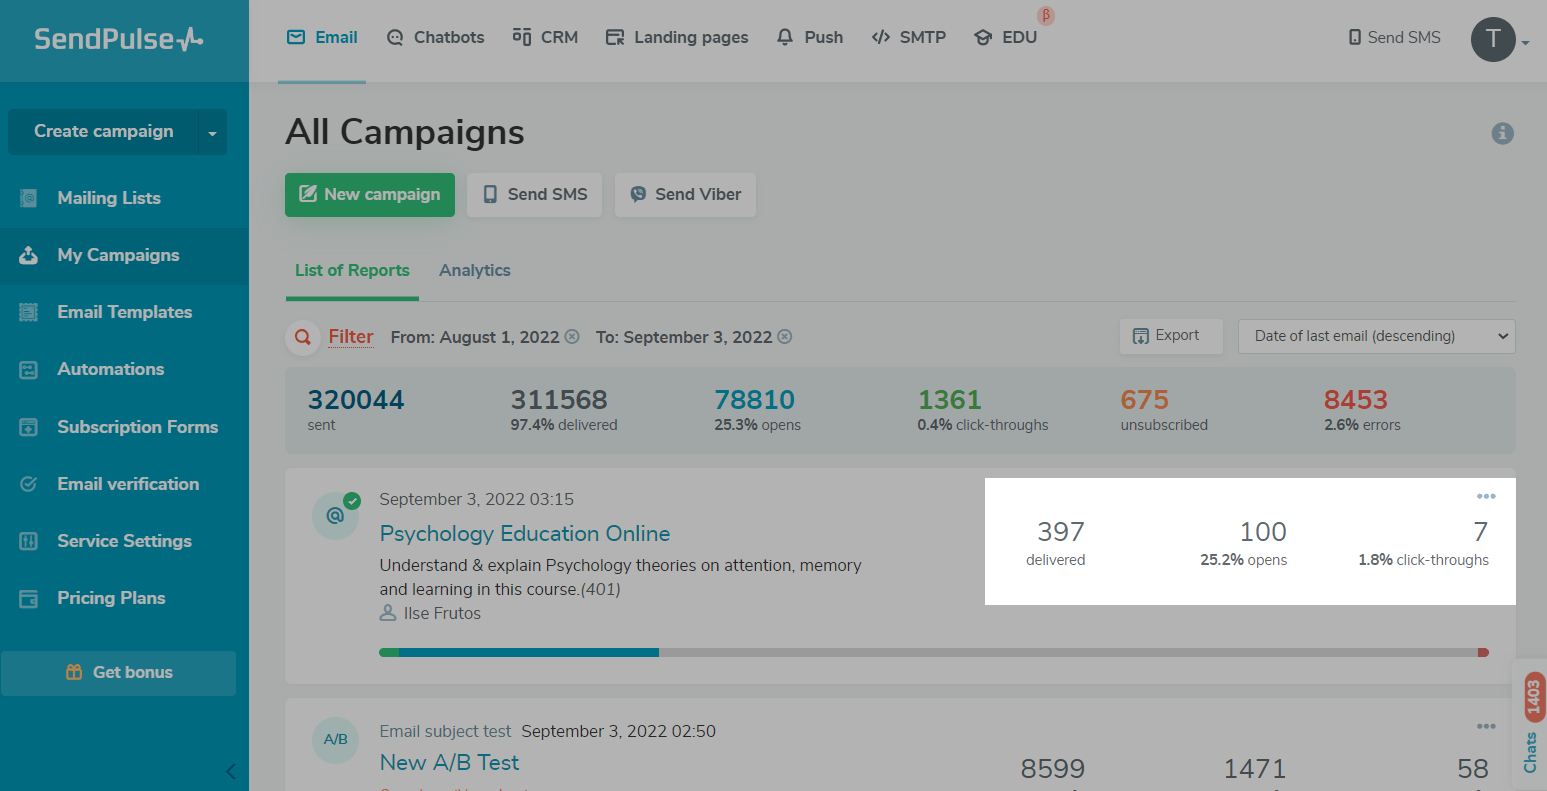
At the top of the list, you will see the total number of sent, delivered, and read emails, click-throughs, unsubscribes, and delivery errors for the time selected in the filter.
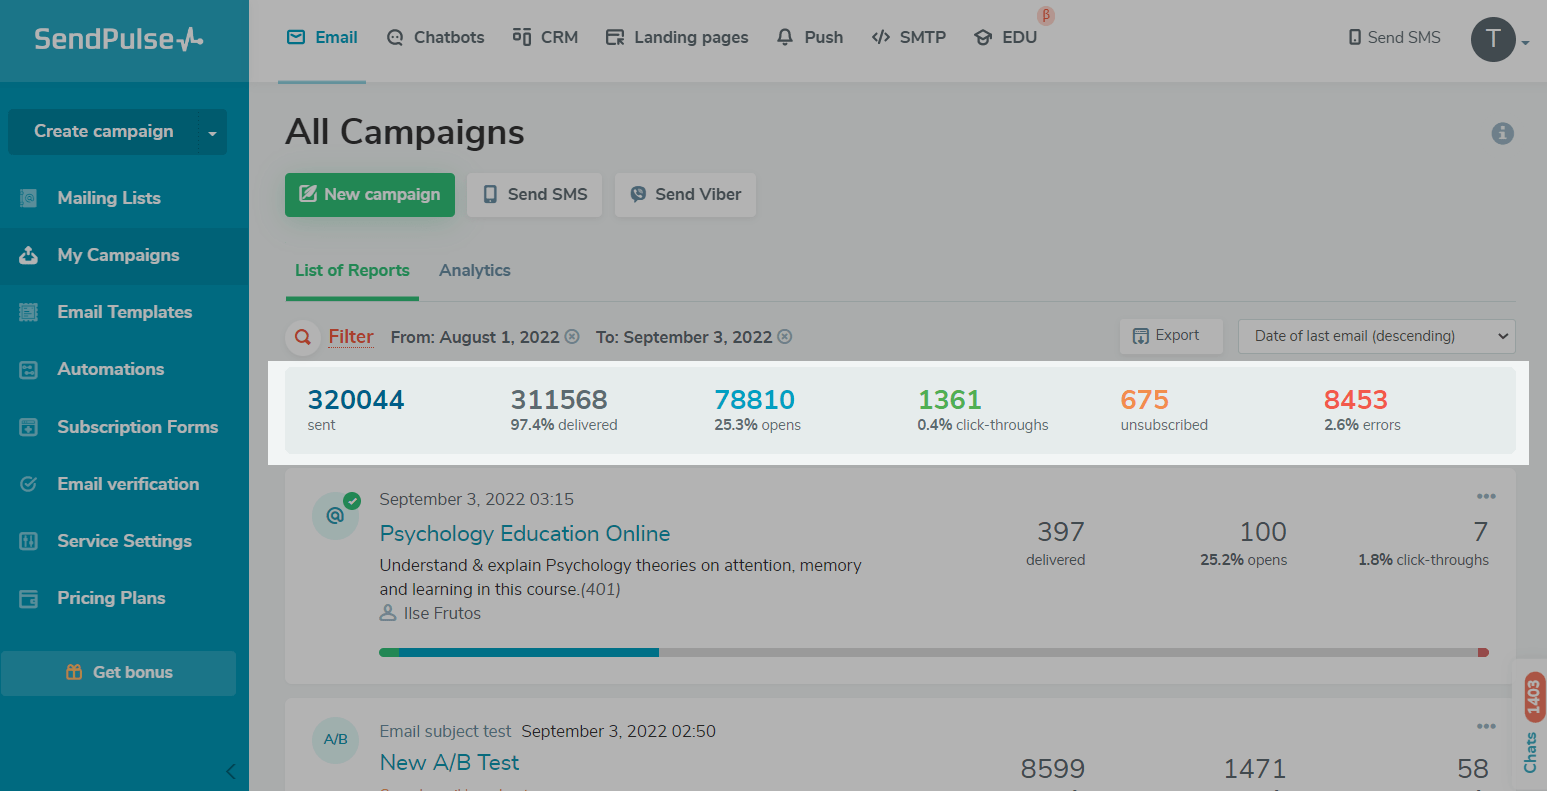
You can also view your number of delivered emails, opens, and click-throughs for each campaign.
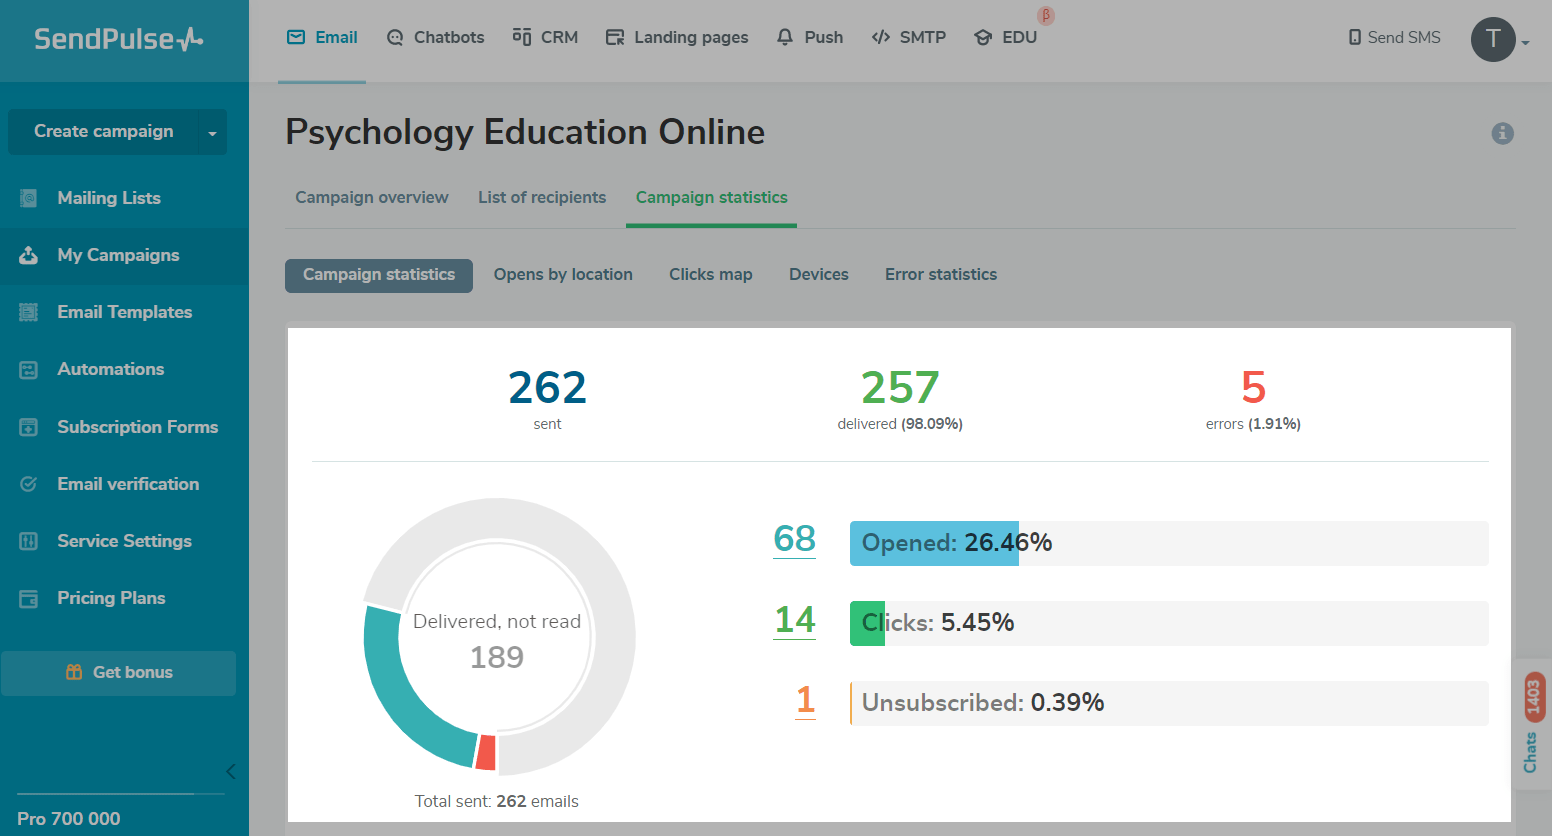
Open a campaign from the list to view its detailed statistics.
In the Campaign statistics > Campaign statistics tab, you can view your overall statistics on sent, delivered, and read emails, as well as the number of click-throughs and delivery errors for all time.
Below is the graph of subscriber activity. By hovering over any point on the graph, you can view the number of read and clicked-through emails for the specified time.
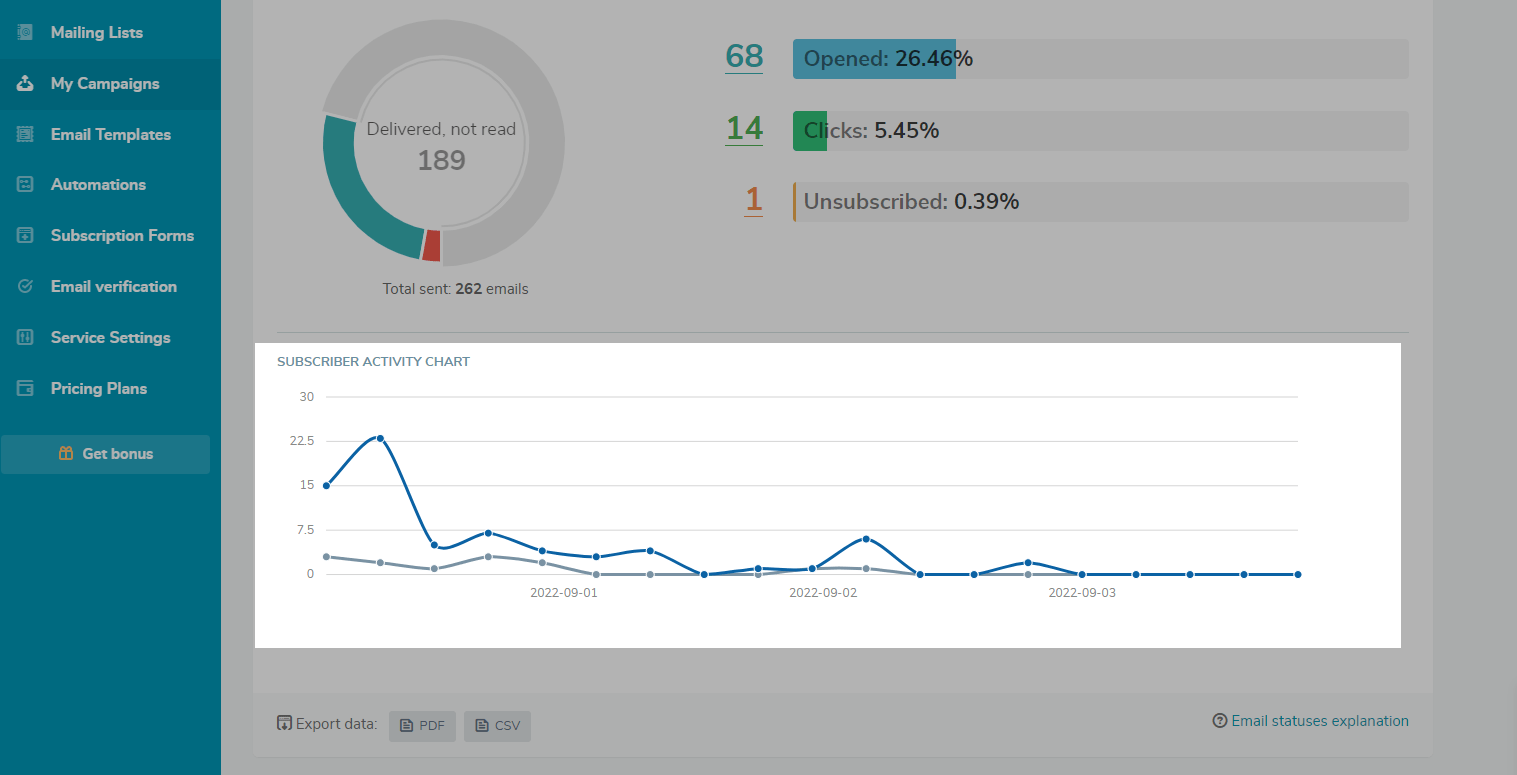
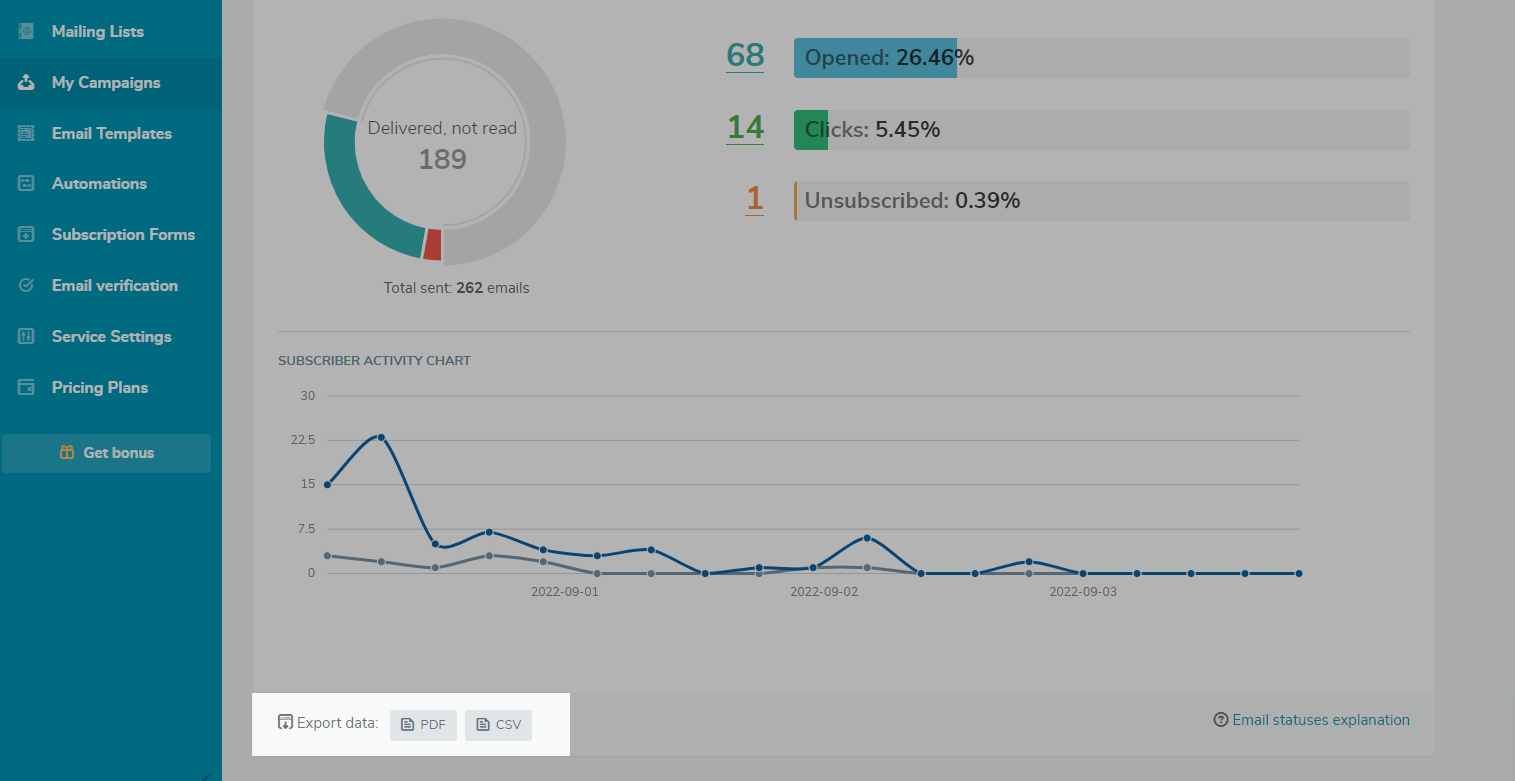
You can also export statistics in PDF or CSV format.
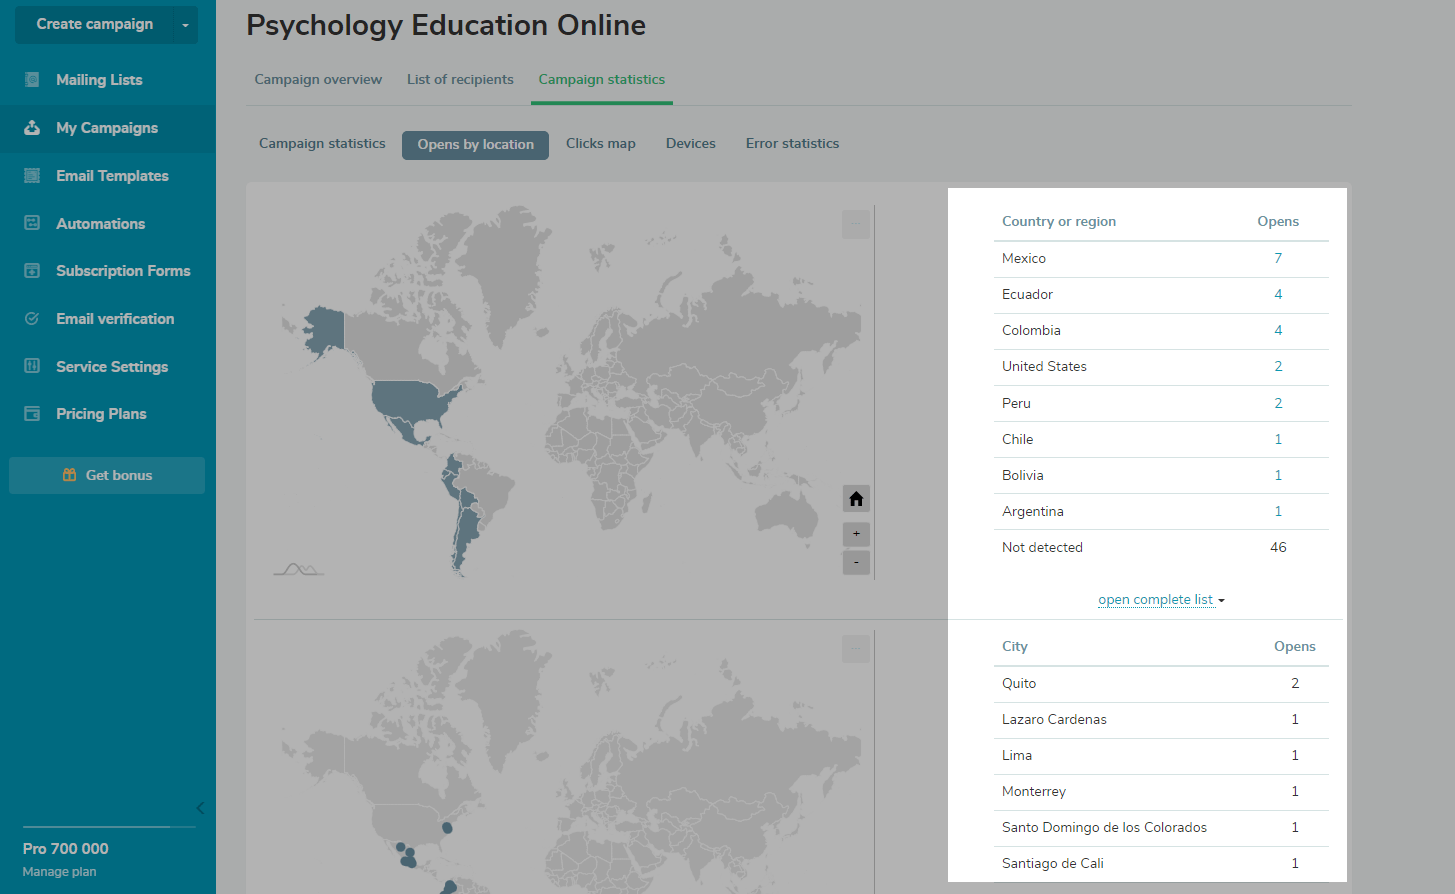
In the Opens by location tab, you can monitor the countries and cities where users opened your campaign. Hover over and scroll to zoom out.
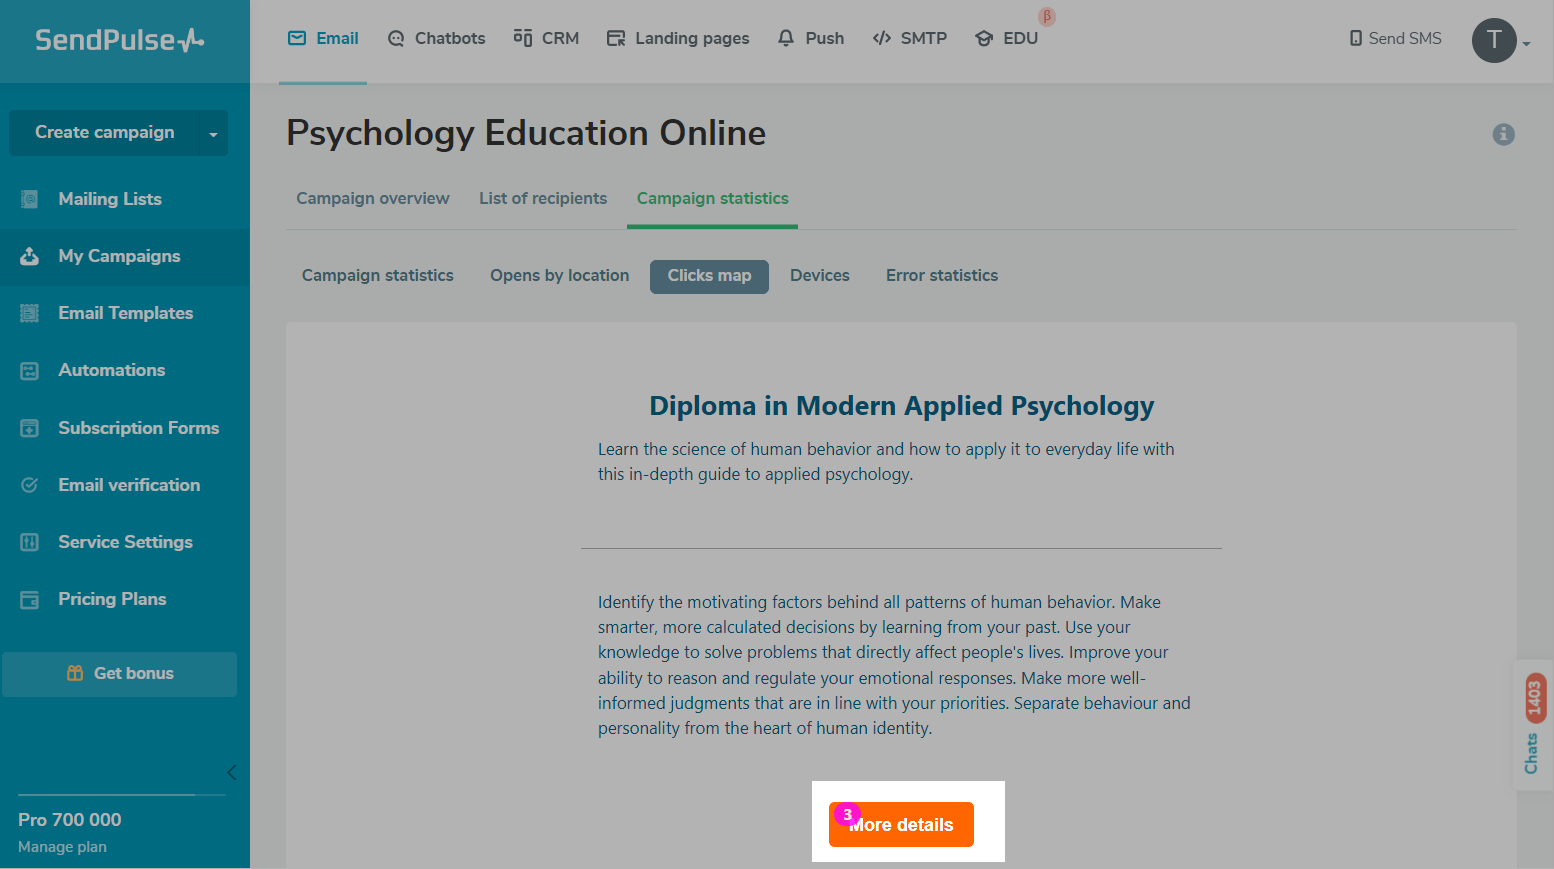
In the Clicks map tab, you can see which link users clicked and how many times they did it, for example, it can be a link in the text or social media button.
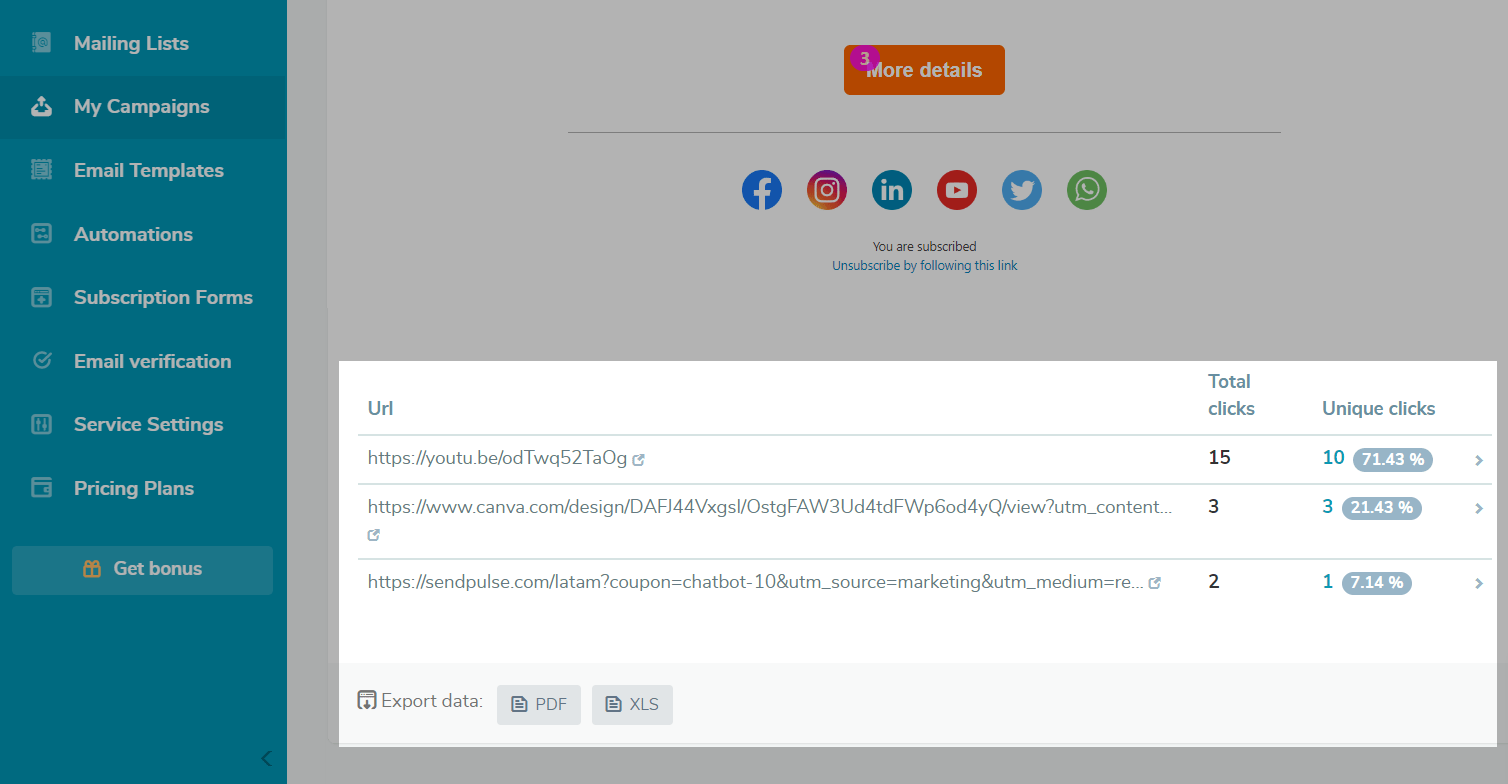
Below is the table with the links users followed and the number of click-throughs (total and unique).
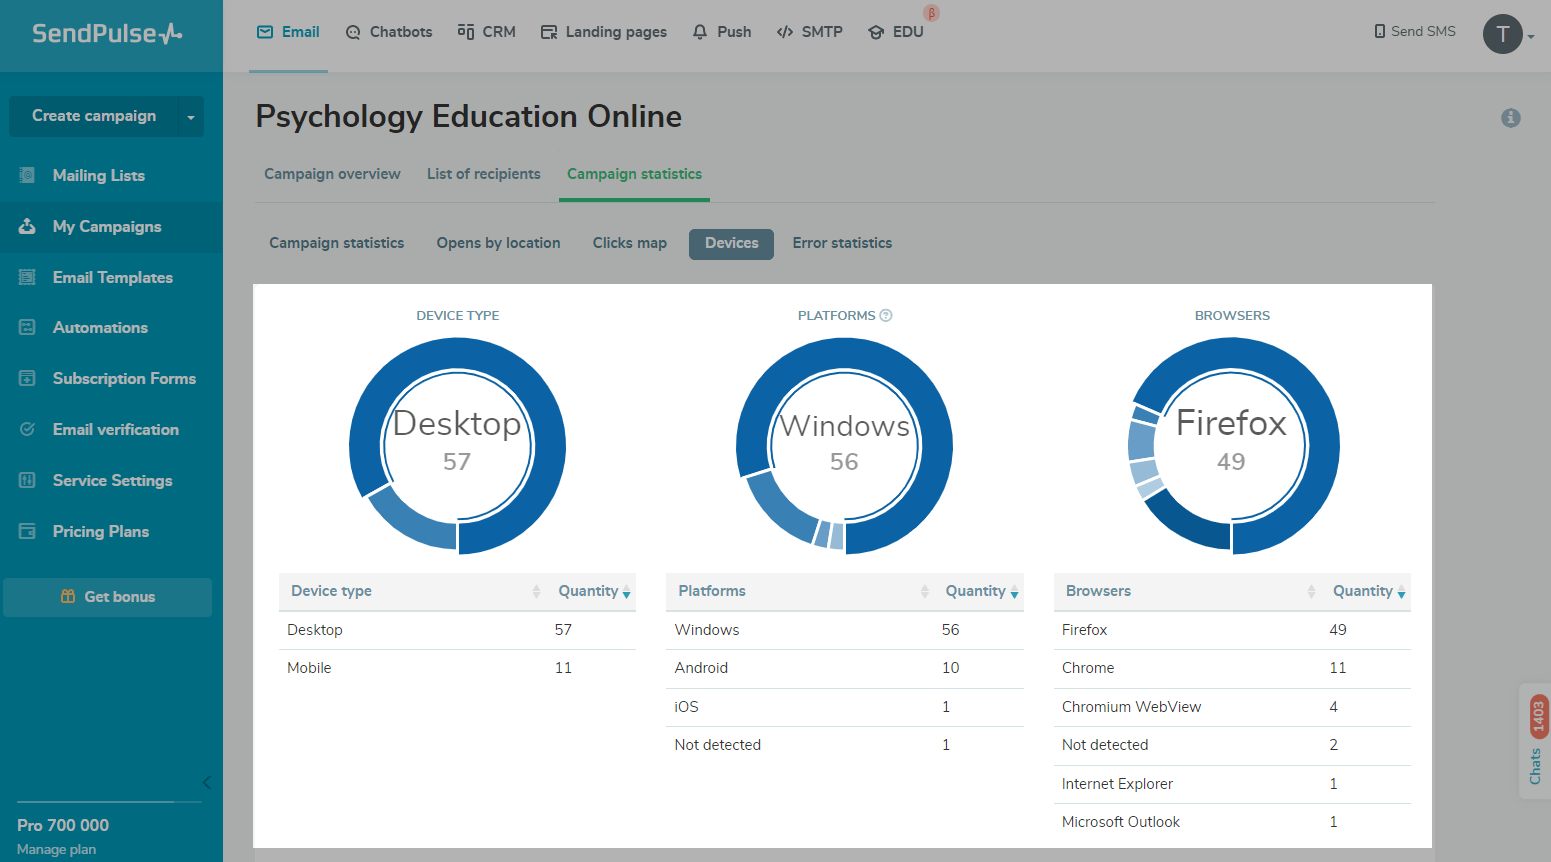
In the Devices tab, you can see which devices and browsers recipients used to open your email.
In the Error statistics tab, you can view the number of email addresses to which your email was not delivered and why.
Read more about errors: Email statuses explanation.
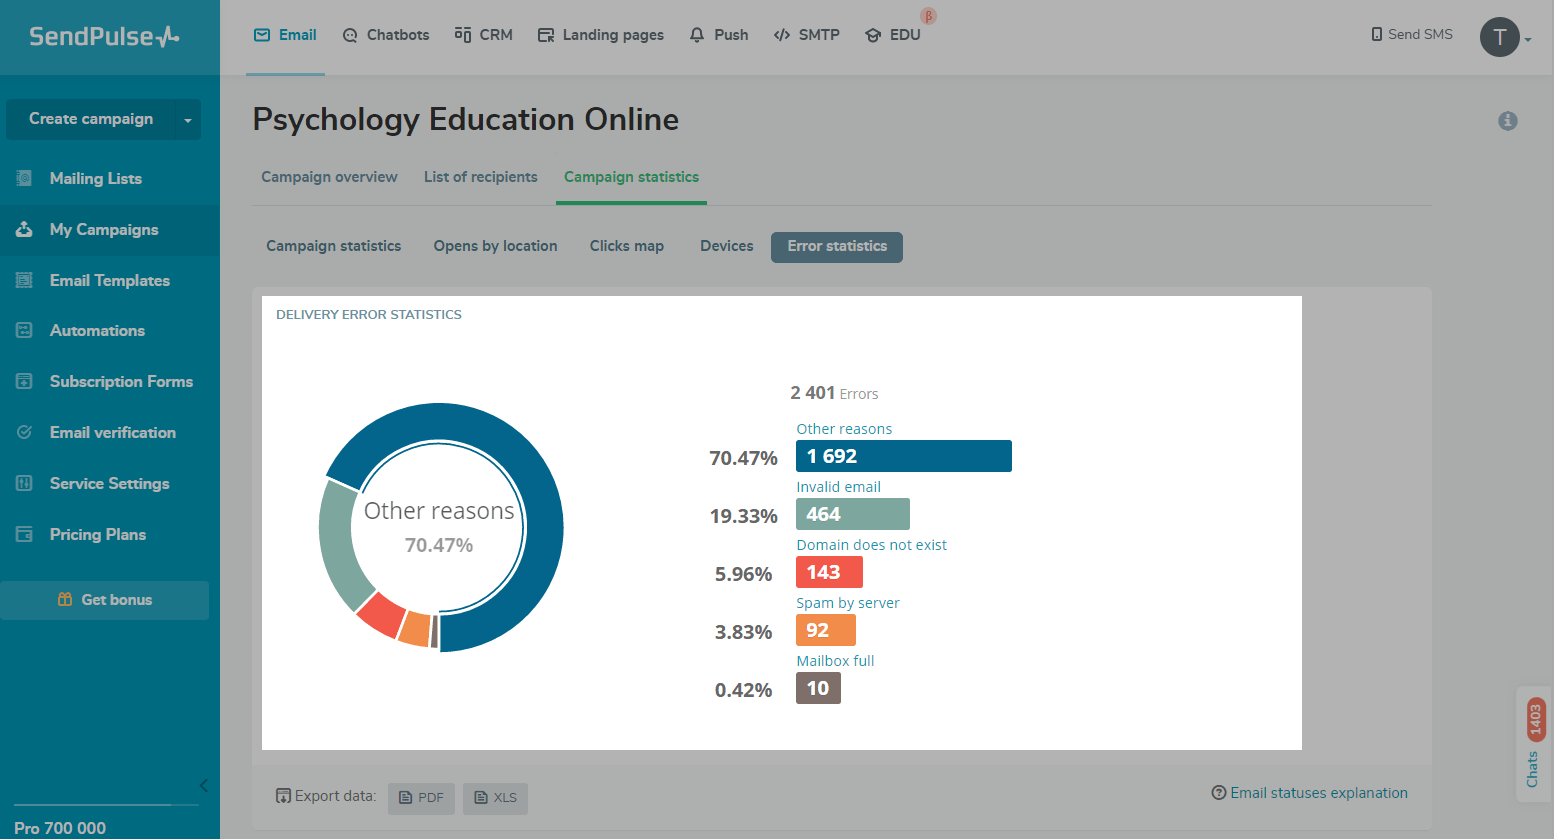
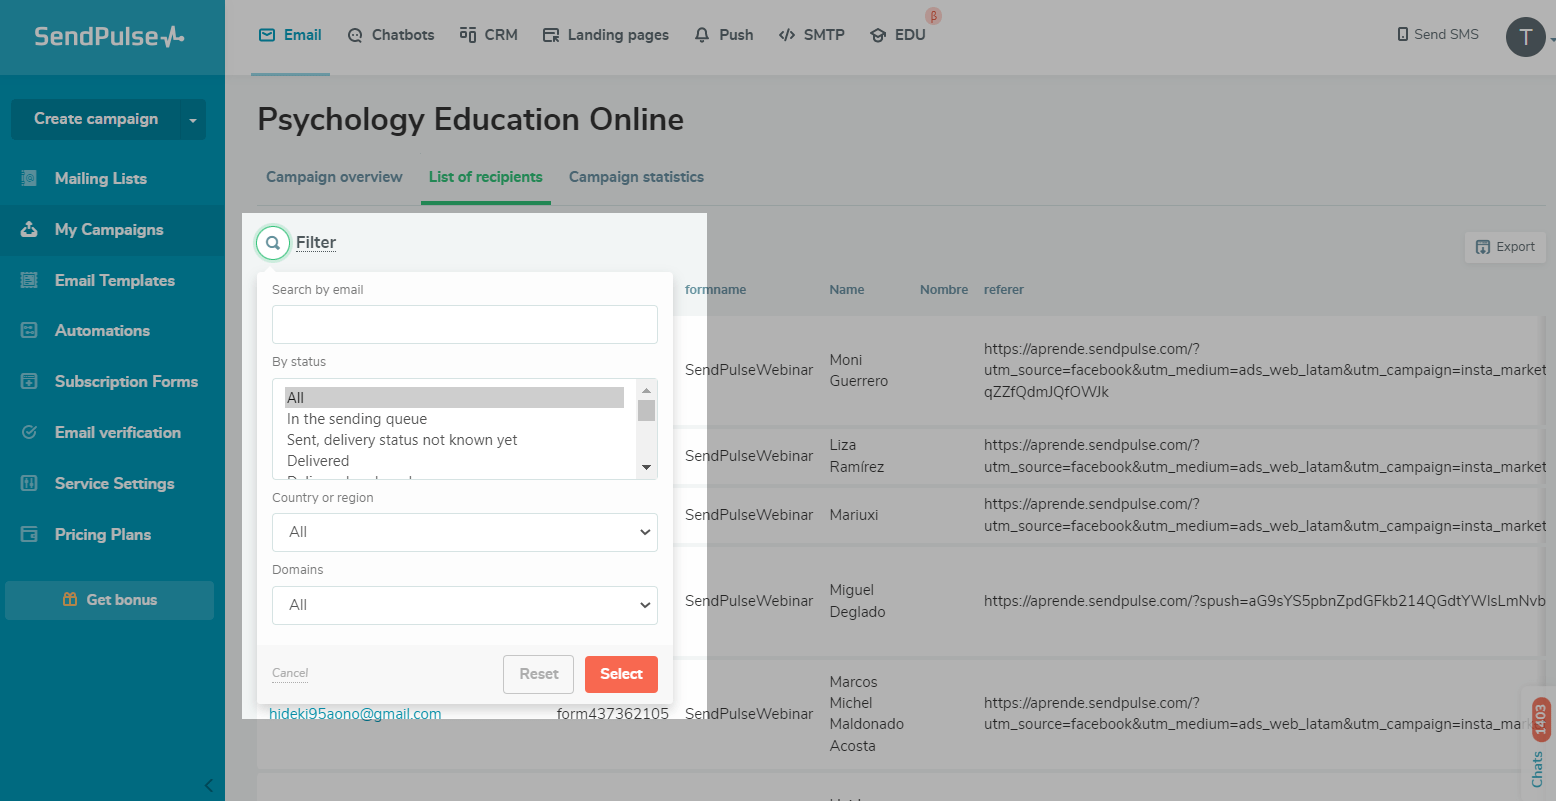
To see the list of email addresses to which your campaign was not delivered, click an error name, or go to the List of recipients tab, and select the corresponding status in the filter.
Potential bot detection
The Bot detection feature allows you to track the number of emails potentially read and clicked through automatically (for example, by an anti-spam bot) in the Campaign statistics and Domain tabs.
This does not influence the total number of read emails. However, you can get more precise statistics and use them for contact segmentation to send emails that are more likely to be opened by actual customers.
In Google Analytics
On July 1, 2023, standard Universal Analytics properties will stop processing data, and support for Analytics 360 properties will only continue until July 1, 2024. The supported and recommended version is Google Analytics 4.
If you have a Google Analytics counter installed on your website, you can also track your user and traffic acquisition in Google Analytics.
Log in to your Google Analytics account.
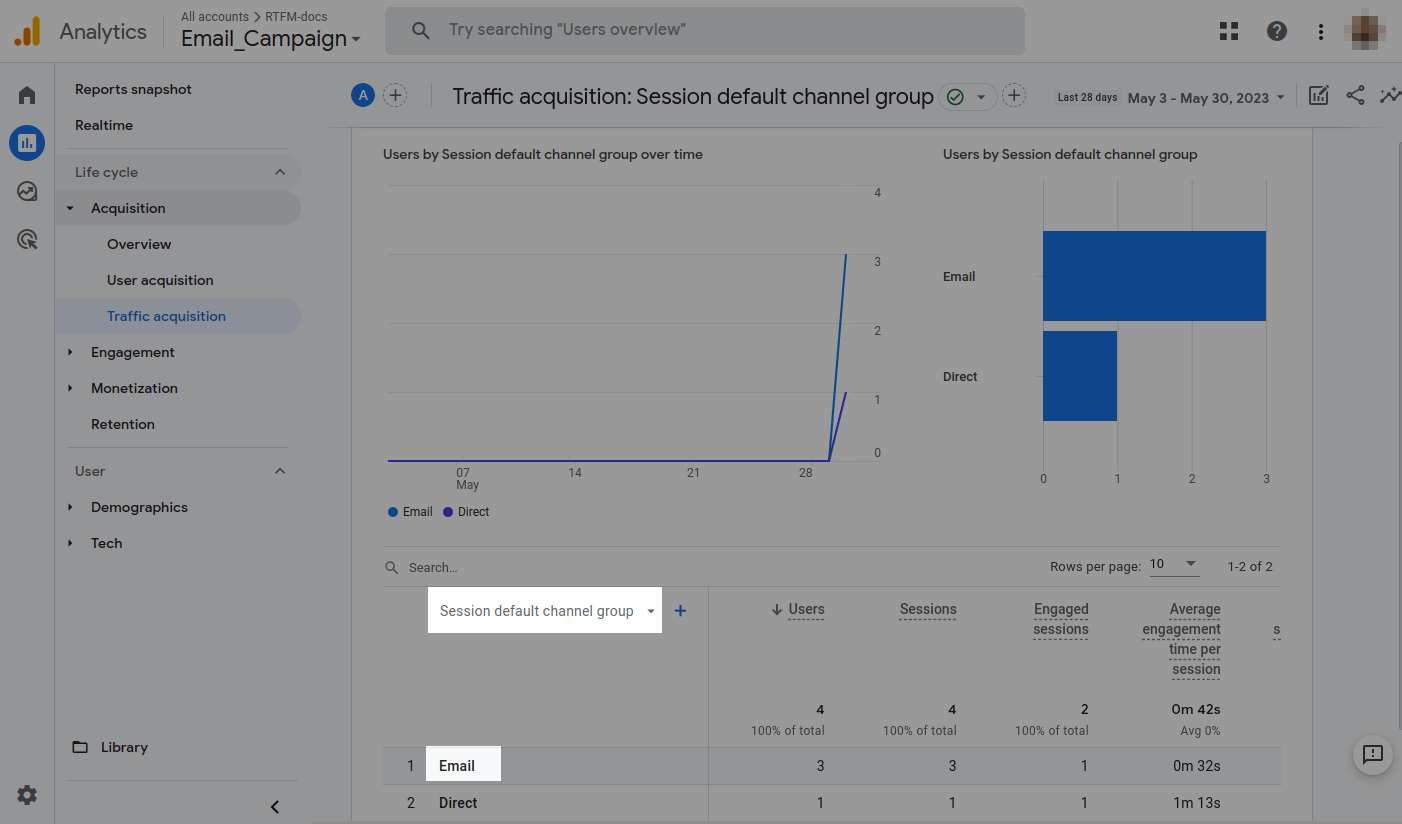
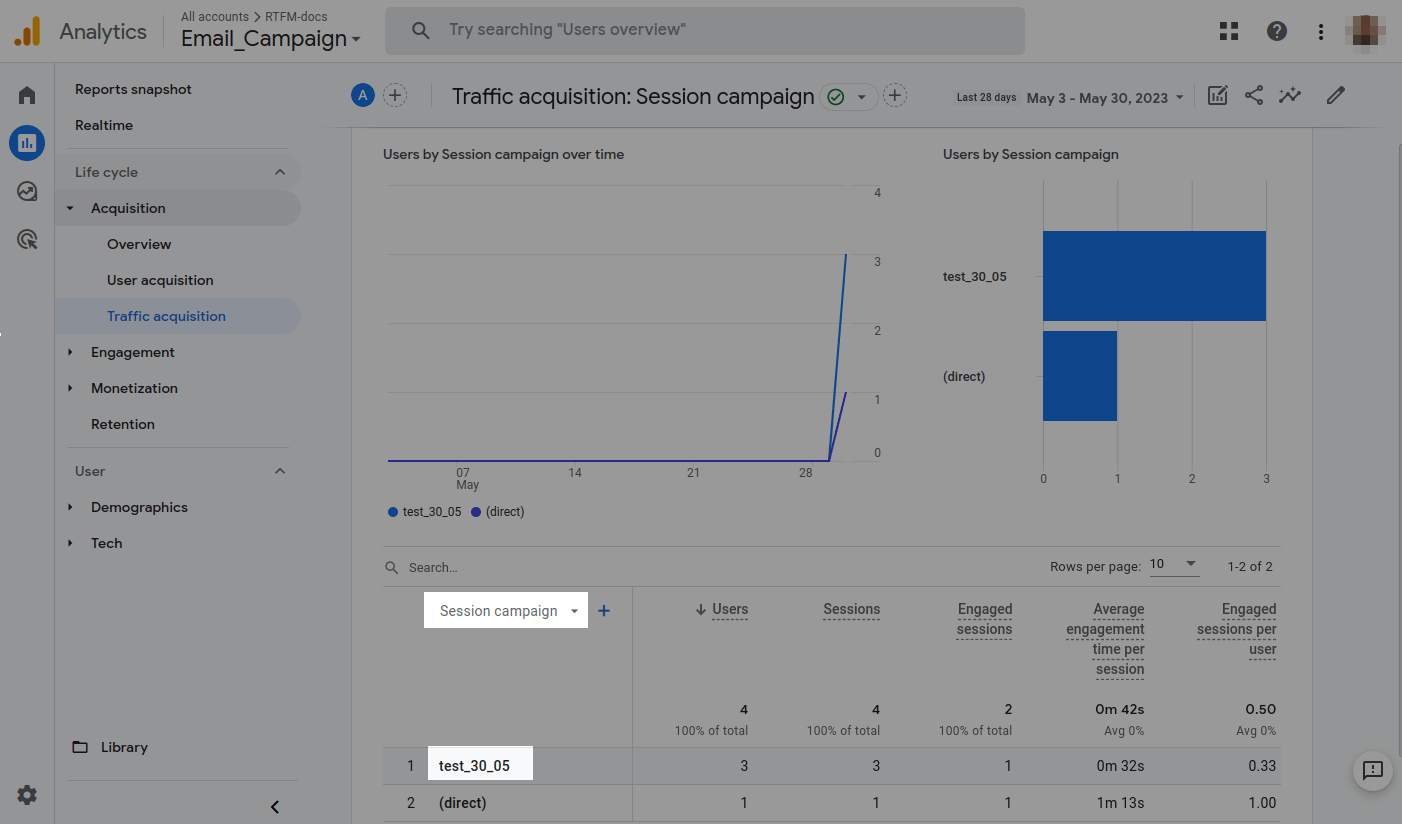
To see detailed statistics on click-throughs and user sessions, go to Reports > Life Cycle > Acquisition > Traffic acquisition.
In Acquisition > User acquisition, you can view your users’ demographic data.
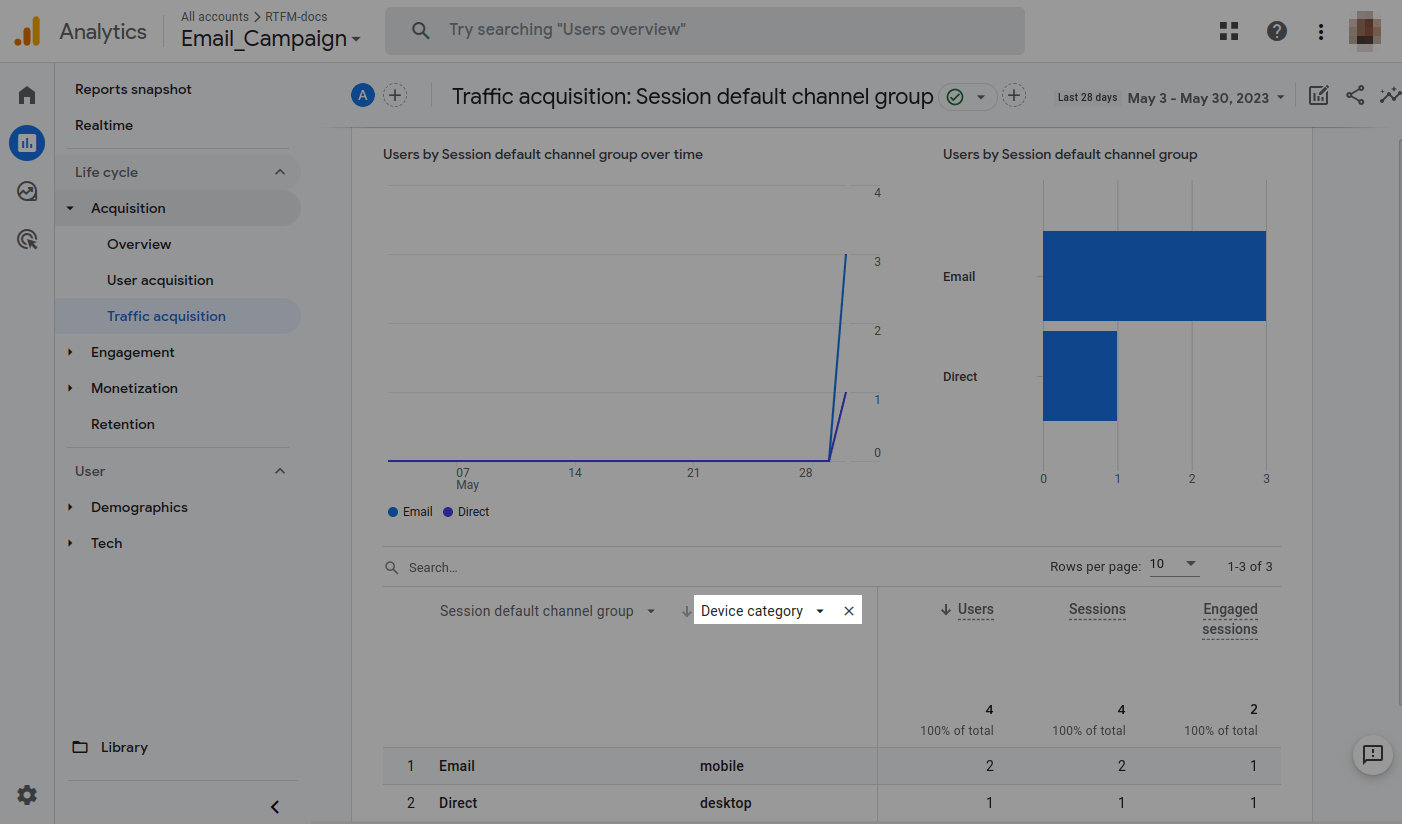
The metrics in both sections are built on similar principles. To evaluate your email click-throughs, set Session default channel group as your key parameter, and analyze data from the Email section.
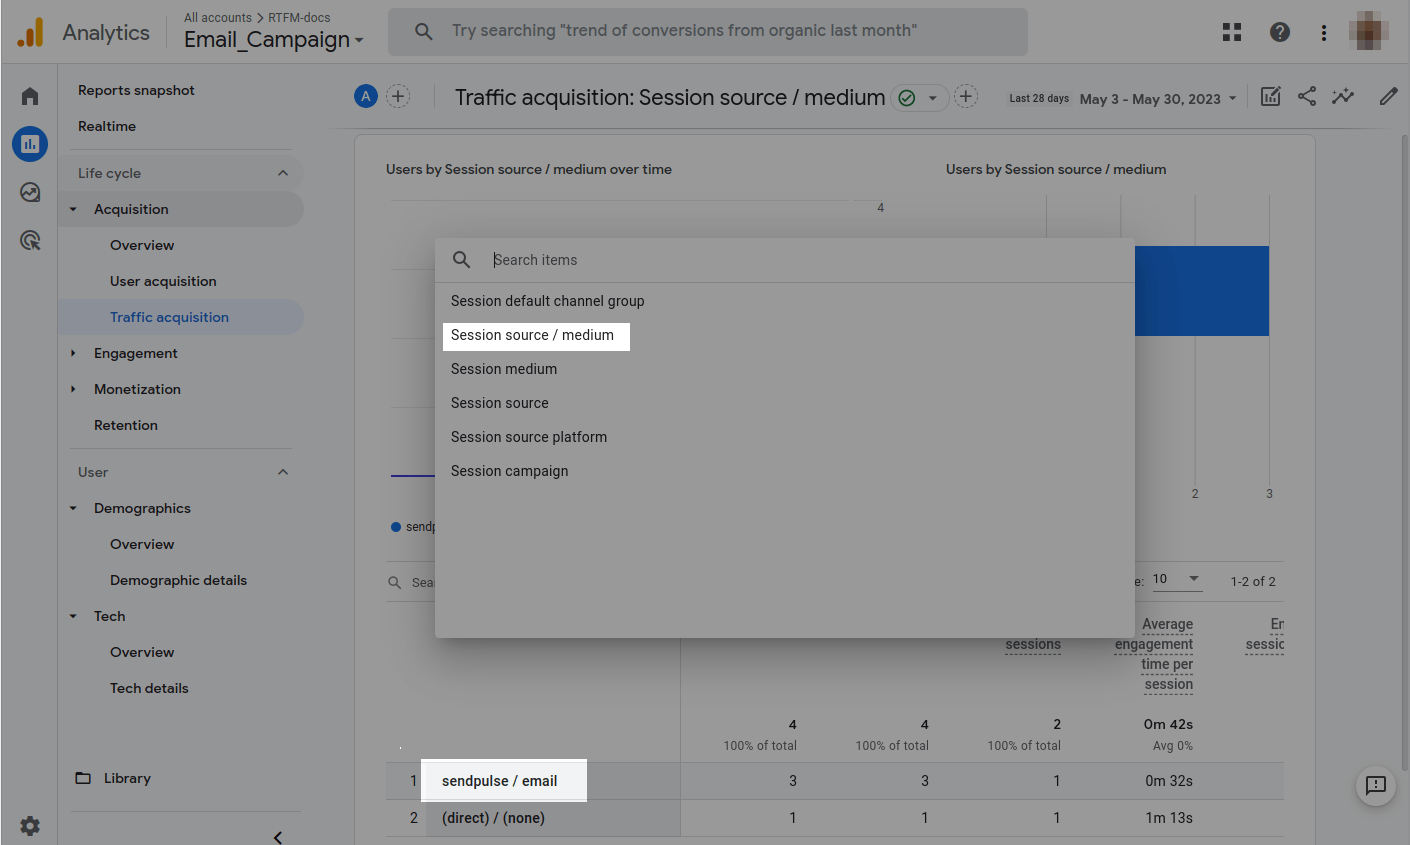
If you use multiple campaign tools and want to highlight only the SendPulse-generated campaigns, set Session source/medium to sendpulse/email.
Select the Session campaign as your key parameter, and find the name that corresponds to your specified utm_campaign label to view campaign statistics.
You can add another column of parameters for analysis. For example, to determine the kinds of devices from which users read your emails and navigate to your site, click the + icon in the table header, and select Device category.
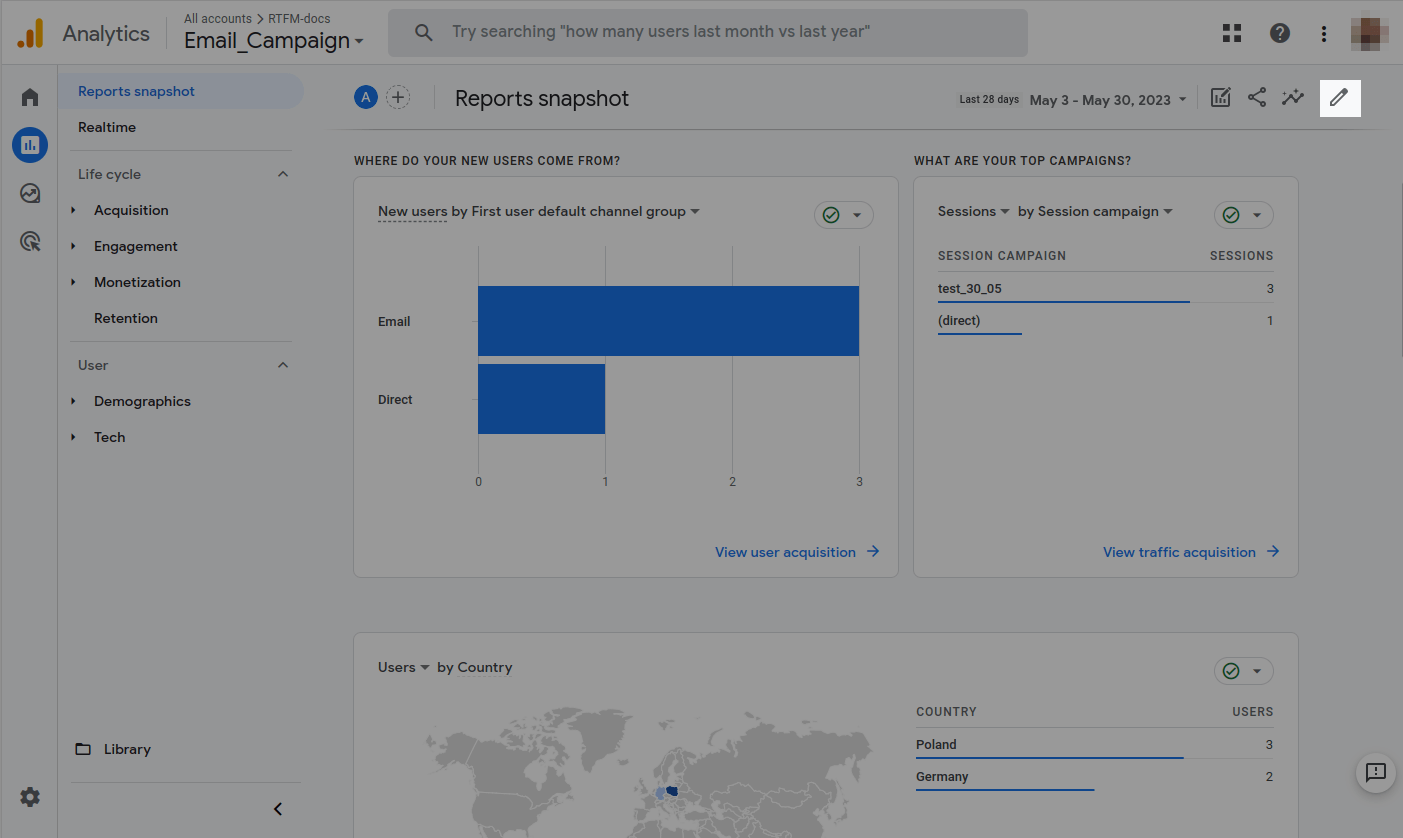
You can also customize the output of all the metrics you want on the “Reports snapshot” page. For example, you can display metrics with data on traffic sources, campaign tags, and user geolocation and then move on to detailed analysis in the relevant sections.
To customize the metrics to be displayed, click the pencil icon in the upper right corner.
Google Analytics metrics can display different data depending on the settings. Check out the Google Analytics 4 documentation to better navigate the service settings.
Last Updated: 07.12.2023
or