The inbox of an average user has turned into a digital Times Square with emails literally competing for reader’s attention. To win the competition, your email must stand out. Marketers resort to various tricks to carve a brand into the memory of the audience. One of the most effective methods is to use infographics.
But what if you’re not an Adobe guru and have no design skills? Read on to find out how to create cool infographics from scratch.
What are infographics?
Infographics are a form of visual representation of information aimed at graphical illustration of complex data quickly and clearly. Graphical illustrations include pictures, icons, charts, schemes, diagrams, maps, and so on.
The benefits of using infographics in email marketing
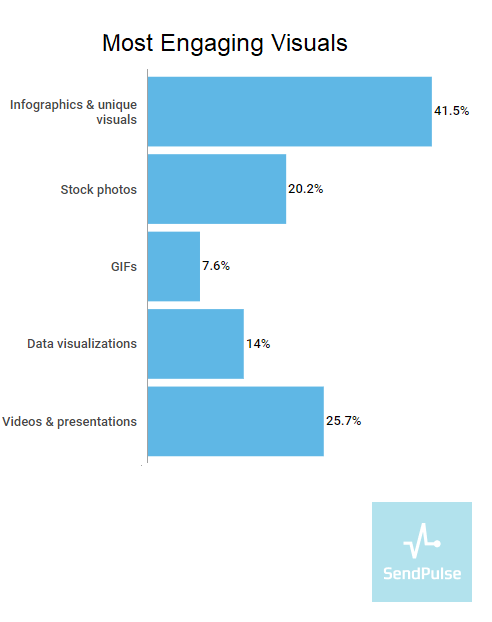
The cold hard fact is that the average human attention span is only 8 seconds — one second shorter than that of a goldfish, by the way. Since people perceive 90% of information visually, the information you send should be eye-catching enough to engage your audience. That’s primarily what infographics do: 41.5% of marketers agree this type of content is the most engaging way to share information visually.
 Source: Venngage
Apart from catching attention, infographics help to
- clarify complex information. Infographics cut a long story short and free our brain from informational clutter, leaving only the essentials for perception.
- increase brand awareness. Your logo, brand name or website URL placed on an infographic link the content you create with your brand and thus help your company get recognized by users in the future.
- take your content viral. Content with images gets 94% more views than content without, making infographics so popular: you have definitely seen content on social media platforms, in emails, blogs, and ads, haven’t you?
- boost traffic. Infographics are highly shareable. And the more people that share your content, the higher Google’s algorithm positions your website, escalating its importance for search engines.
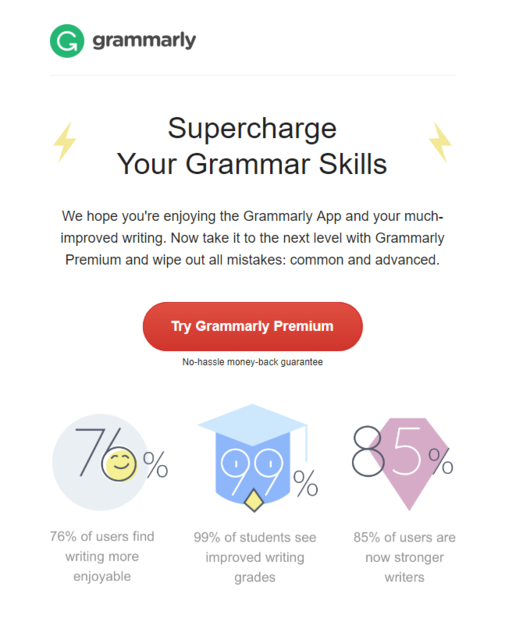
Look how Grammarly used infographics in one of their email campaigns. They offered users to switch to an advanced pricing plan and shared stats on how the users would benefit after the upgrade. By grouping the statistical data into a chart, the company managed to simplify the overall perception of the information and prove their reputation as a trustworthy app for writers.
 An email with infographics from Grammarly
How to make infographics
Step 1. Choose your target audience
No matter how cool your infographic is, addressing it to the wrong people will nullify your design. To fill your infographics with relevant information, think about who is going to read it: teenagers or businesspeople, male or female audience.
Step 2. Define the content
When you know who you’re focusing on, decide what you’re going to tell them. Think of three to five questions your infographics need to answer, study the topic, and group the collected information so that it will make sense.
Step 3. Get visual
Choose how the data will be displayed: in charts, graphs, images, colorful text, maps and so on. Then, design the infographic layout itself.
Colors: pick no more than five colors, including black and white; make sure they all go well with each other and use a different color for titles and paragraphs. A good idea will be also to use colors that align with your brand.
Background: choose a simple and non-distracting background so that it will correlate with your color palette.
Fonts: stick to one main font and use bold or italic font to highlight the subtitles so that your text will become more readable.
Graphic elements: charts, graphs, images, and icons have to resonate with the color scheme without overloading the overall view.
Step 4. Customize
Add your logo or links to videos to boost conversions and the sharing of your content. As big files might fail to get shared online, make your infographic under 2 MB and save it in JPEG or PNG format.
Now that you know all the steps and are ready to get started, we’ll walk you through free and affordable online tools to help you create your own infographics.
Cost: Free for basic plan, $19 a month for Pro plan, $67 for Business, $149 for Team using and negotiable pricing for Enterprise plan. By upgrading your pricing plan, you’ll get access to a wider range of templates, customization, and analytics options.
This design tool has a user-friendly interface and features more than 20 ready-made templates, 35+ interactive charts, and over 550 maps. In case you haven’t found appealing images, just upload your own. Drag and drop charts, customizing them to your preferences and needs. Downloading of created infographics, however, is available on upgraded plans only, as well as storing your projects privately.
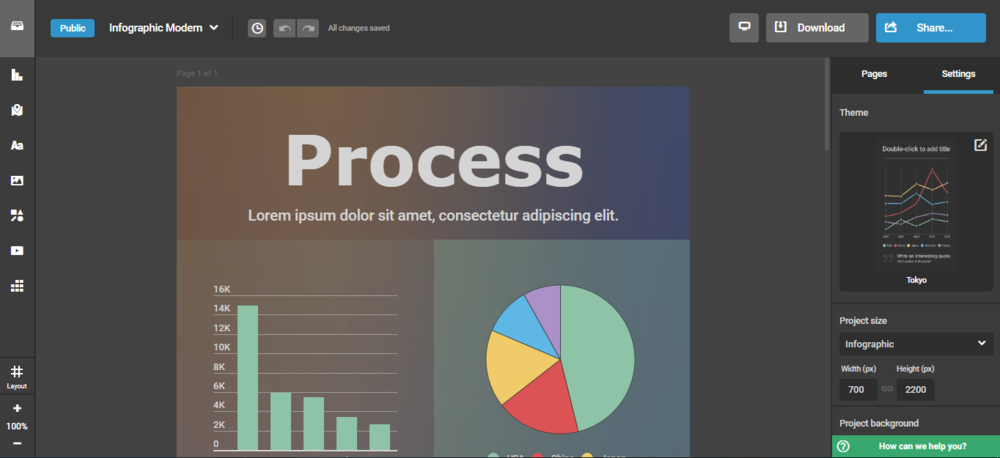
The service has a sidebar menu with all choices available, an editing menu, plus layout and zooming options.
 Infogram interface
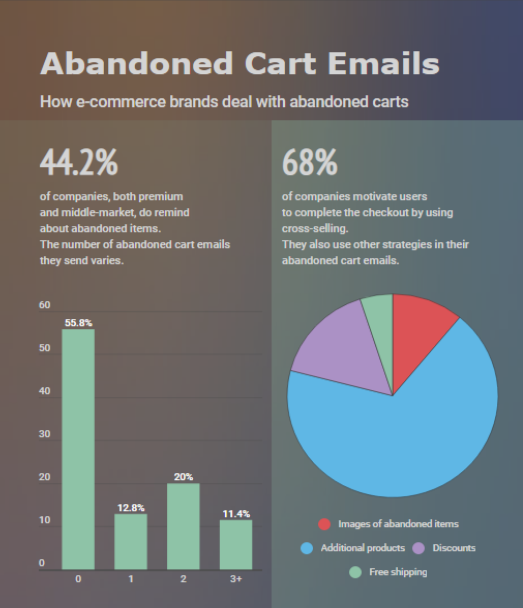
We used Infogram to outline the key points of our research about abandoned cart emails:
 Infographics created with Infogram
Time spent getting familiar with the tool: 60 mins.
Time spent creating the infographic: 30 mins.
Cost: Free for Basic plan, $12.95 a month for a Work plan, negotiable pricing for Enterprise plan. With an upgraded pricing plan, you’ll get access to 400.000 free photos, illustrations, and templates, and will be able to customize your design and organize your working space.
Canva is one of the most popular infographic design tools as it offers over a million images to be used. Browse through 60,000 pre-made templates and choose from more than 100 fonts to create, edit and adjust your unique content and share it via email, on any social media platform, or blogs.
The service has a sidebar that offers a convenient drag-and-drop editor with a variety of options for your infographics design.
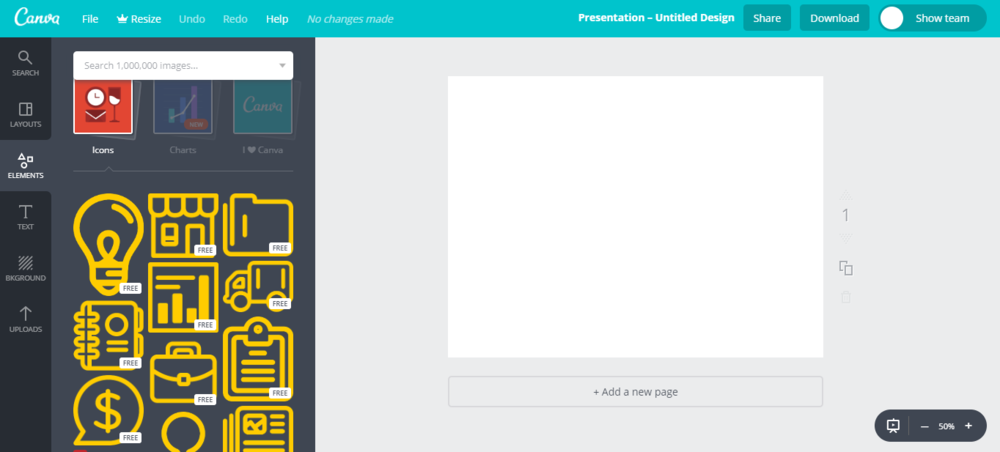 Canva interface
We chose Canva to create a short walkthrough on high sender reputation:
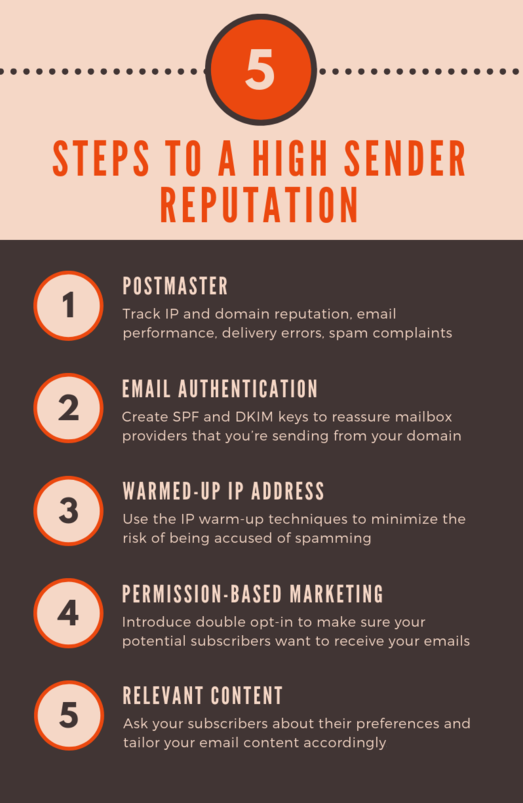 Infographics created with Canva
Time spent getting familiar with the tool: 30 mins.
Time spent creating the infographic: 10 mins.
Cost: Free for students, $19 a month for a Premium account and $49 a month for a Business plan. An upgraded pricing plan will reveal premium charts, icons, and templates. You’ll also be able to control the privacy of your infographics, get email and chat support, and download your creations in various formats.
With its highly-intuitive design, Venngage allows you to create infographics using a wide range of free ready-made templates and enjoy their unlimited customization.
The service has a sidebar with many available options and a text formatting menu.
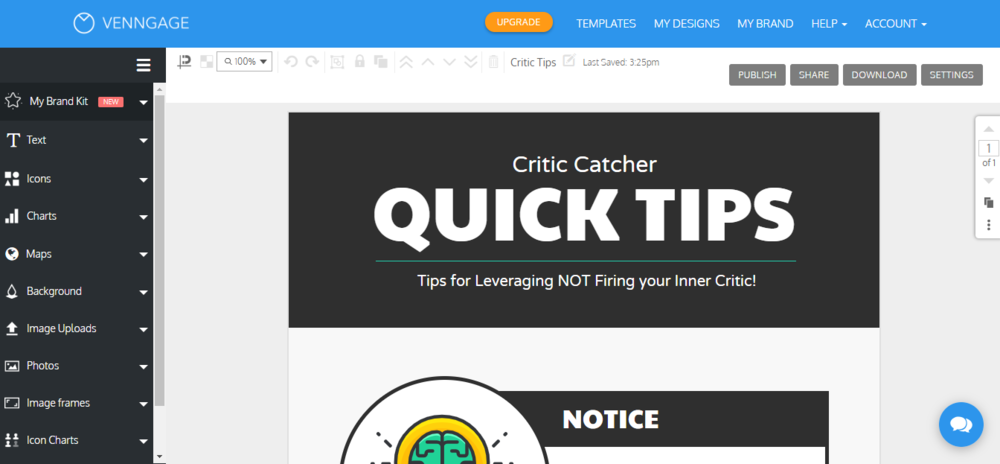 Venngage interface
Venngage helped us outline three core emails for a re-engagement series:
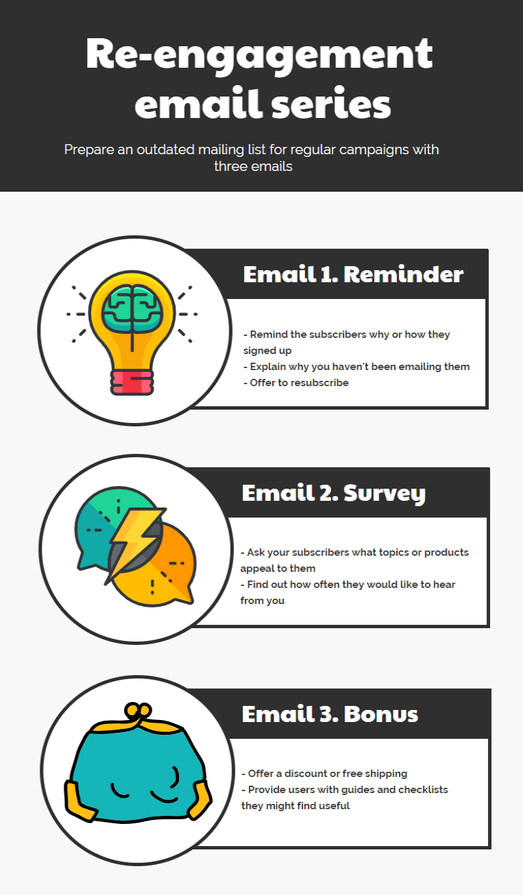 Infographics created with Venngage
Time spent getting familiar with the tool: 30 mins.
Time spent creating the infographic: 15 mins.
Other online infographics tools you can try:
Final words
Creating your own infographics is possible without having a design team at hand. Remember, nailing any kind of skill takes time, thinking, diligence, and dedication. All graphic design experts once started somewhere too. Just choose the tool that suits you best, take your time to craft the infographic that will pop in your readers’ memory and send it in your email campaigns with SendPulse.